Figure1 (Figure1)
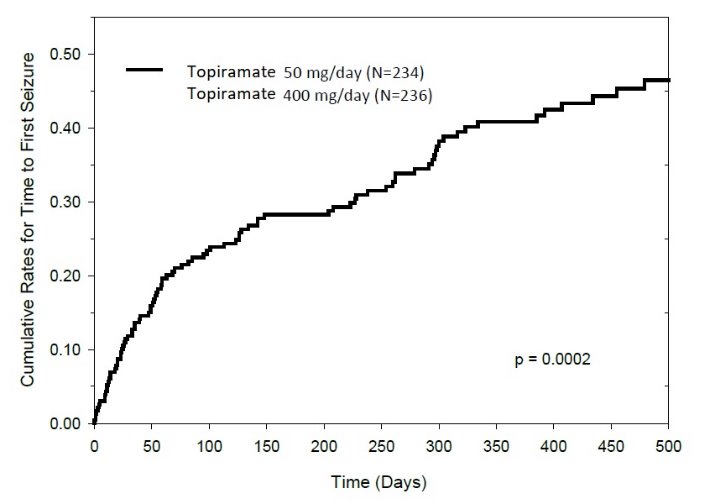
This is a table showing the cumulative rates for the time to the first seizure for two groups: one group taking Topiramate 50 mg/day (N=234) and the other group taking Topiramate 400 mg/day (N=236). The chart displays time in days on the x-axis and the cumulative rates on the y-axis. This data can be used to compare the effectiveness of the two different doses of Topiramate in preventing seizures over time.*