Irbesartan And Hydrochlorothiazide
Product Images NDC 68645-405

9 FDA label images from Legacy Pharmaceutical Packaging · Packaging, Regulatory Labels, and Product Appearance

Product Visual Gallery

This gallery contains 9 technical images submitted to the FDA as part of the official labeling for Irbesartan And Hydrochlorothiazide (NDC 68645-405). Unlike standard consumer photos, these assets often include clinical data figures, molecular chemical structures, and official manufacturer packaging layouts.

As provided by Legacy Pharmaceutical Packaging, these visuals offer a comprehensive scientific overview of the product's physical and chemical identity, aiding pharmacists and researchers in product verification and study.

FDA Label Image

Figure 1a (Irbesartan And Hydrochlorothiazide Tablets Usp Eco 1)

Figure 1a (Irbesartan And Hydrochlorothiazide Tablets Usp Eco 1)
A line graph showing the percentage of subjects with baseline systolic blood pressure (SBP) under 140 mmHg across different baseline SBP levels (140 to 220 mmHg). It compares results from studies labeled Irbesartan and Hydrochlorothiazide (HCTZ) Study V, Irbesartan Study V, HCTZ Study VI, Irbesartan and HCTZ Study VI, and Irbesartan Study VI, using distinct line types and colors in the legend.*
FDA Label Image

Figure 1b (Irbesartan And Hydrochlorothiazide Tablets Usp Eco 2)

Figure 1b (Irbesartan And Hydrochlorothiazide Tablets Usp Eco 2)
A line graph comparing the percentage of patients with baseline systolic blood pressure (SBP) under 130 mmHg for different studies involving Irbesartan and Hydrochlorothiazide (HCTZ) and Irbesartan alone. The x-axis shows baseline SBP in mmHg from 140 to 220, and the y-axis shows the percentage of patients with SBP under 130 mmHg from 0 to 100%.*
FDA Label Image

Figure 2a (Irbesartan And Hydrochlorothiazide Tablets Usp Eco 3)

Figure 2a (Irbesartan And Hydrochlorothiazide Tablets Usp Eco 3)
A line graph showing percentage change in diastolic blood pressure (DBP) versus baseline DBP (mmHg) for Irbesartan and Hydrochlorothiazide in Study V, Irbesartan alone in Study V, Hydrochlorothiazide alone in Study V, and corresponding data for Study VI. The graph compares four treatment groups over a range of baseline DBP values.*
FDA Label Image

Figure 2b (Irbesartan And Hydrochlorothiazide Tablets Usp Eco 4)

Figure 2b (Irbesartan And Hydrochlorothiazide Tablets Usp Eco 4)
A line graph comparing percent of diastolic blood pressure (DBP) less than 80 mmHg versus baseline DBP (mmHg) for Irbesartan and Hydrochlorothiazide (HCTZ) studies V and VI, as well as individual Irbesartan and HCTZ studies V and VI. The graph shows five different plotted lines representing these study groups.*
FDA Label Image

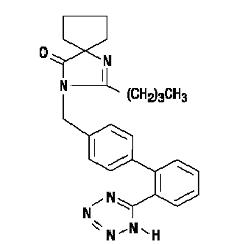
Irbesartan Chemical Structure (Irbesartan And Hydrochlorothiazide Tablets Usp Eco 5)

Irbesartan Chemical Structure (Irbesartan And Hydrochlorothiazide Tablets Usp Eco 5)
Chemical structure diagram showing the molecular arrangement of the active ingredient in Irbesartan and Hydrochlorothiazide, highlighting its characteristic rings and side chains.*
FDA Label Image

Hctz Chemical Structure (Irbesartan And Hydrochlorothiazide Tablets Usp Eco 6)

Hctz Chemical Structure (Irbesartan And Hydrochlorothiazide Tablets Usp Eco 6)
Chemical structure diagram of the active ingredient associated with Irbesartan and Hydrochlorothiazide brand product by Legacy Pharmaceutical Packaging, showing atoms and bonds including sulfur, oxygen, nitrogen, chlorine, and carbon in a ring and sulfonamide groups.*
FDA Label Image

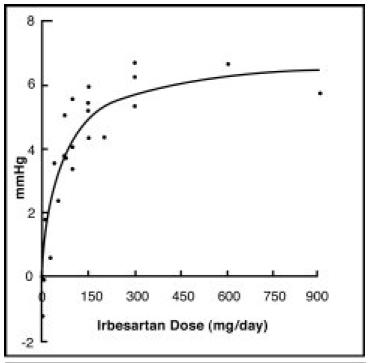
Figure 3 (Irbesartan And Hydrochlorothiazide Tablets Usp Eco 7)

Figure 3 (Irbesartan And Hydrochlorothiazide Tablets Usp Eco 7)
A scatter plot with a fitted curve illustrating the relationship between Irbesartan dose (mg/day) on the x-axis and an effect measured in mmHg on the y-axis. Data points vary around the curve, which rises steeply at low doses and levels off at higher doses up to 900 mg/day.*
FDA Label Image

Figure 4 (Irbesartan And Hydrochlorothiazide Tablets Usp Eco 8)

Figure 4 (Irbesartan And Hydrochlorothiazide Tablets Usp Eco 8)
A dose-response curve graph depicting the relationship between Irbesartan dose (mg/day) on the x-axis and blood pressure reduction (mmHg) on the y-axis. Data points are plotted, showing an initial steep increase in effect that plateaus at higher doses around 600-900 mg/day.*
FDA Label Image

Irbesartan And Hydrochlorothiazide Tablets Usp 150mg/12.5mg (Irbesartan And Hydrochlorothiazide Tablets Usp Eco 9)

Irbesartan And Hydrochlorothiazide Tablets Usp 150mg/12.5mg (Irbesartan And Hydrochlorothiazide Tablets Usp Eco 9)
Packaging label for Irbesartan and Hydrochlorothiazide Tablets USP 150 mg/12.5 mg. The child-resistant carton holds 30 tablets, manufactured by Legacy Pharmaceutical Packaging for TEVA Pharmaceuticals USA and distributed by Wal-Mart Stores. The label features instructions for opening the child-resistant pack and shows logos for Walmart and Sam's Club. The tablets are marked with "7238" and "TEVA."*

* About these descriptions: Image descriptions on this page are generated by automated AI analysis of the product label images from the manufacturer's FDA label submission (SPL). They are provided for reference only and may contain errors or omissions. Always rely on the printed label itself and the official FDA labeling, and consult a pharmacist or healthcare professional with any questions about this product.