Tetrabenazine Tablet
Product Images NDC 68682-421

5 FDA label images from Oceanside Pharmaceuticals · Packaging, Regulatory Labels, and Product Appearance

Product Visual Gallery

This gallery contains 5 technical images submitted to the FDA as part of the official labeling for Tetrabenazine (NDC 68682-421). Unlike standard consumer photos, these assets often include clinical data figures, molecular chemical structures, and official manufacturer packaging layouts.

As provided by Oceanside Pharmaceuticals, these visuals offer a comprehensive scientific overview of the product's physical and chemical identity, aiding pharmacists and researchers in product verification and study.

FDA Label Image

Carton-12.5mg.jpg (Carton 12.5mg.jpg)

Carton-12.5mg.jpg (Carton 12.5mg.jpg)
Packaging label for Tetrabenazine Tablets 12.5 mg by Oceanside Pharmaceuticals. The label indicates each tablet contains 12.5 mg tetrabenazine and the package includes 112 tablets. It includes storage instructions and distributor and manufacturer information, with a barcode and a note for pharmacists to dispense the medication guide to patients.*
FDA Label Image

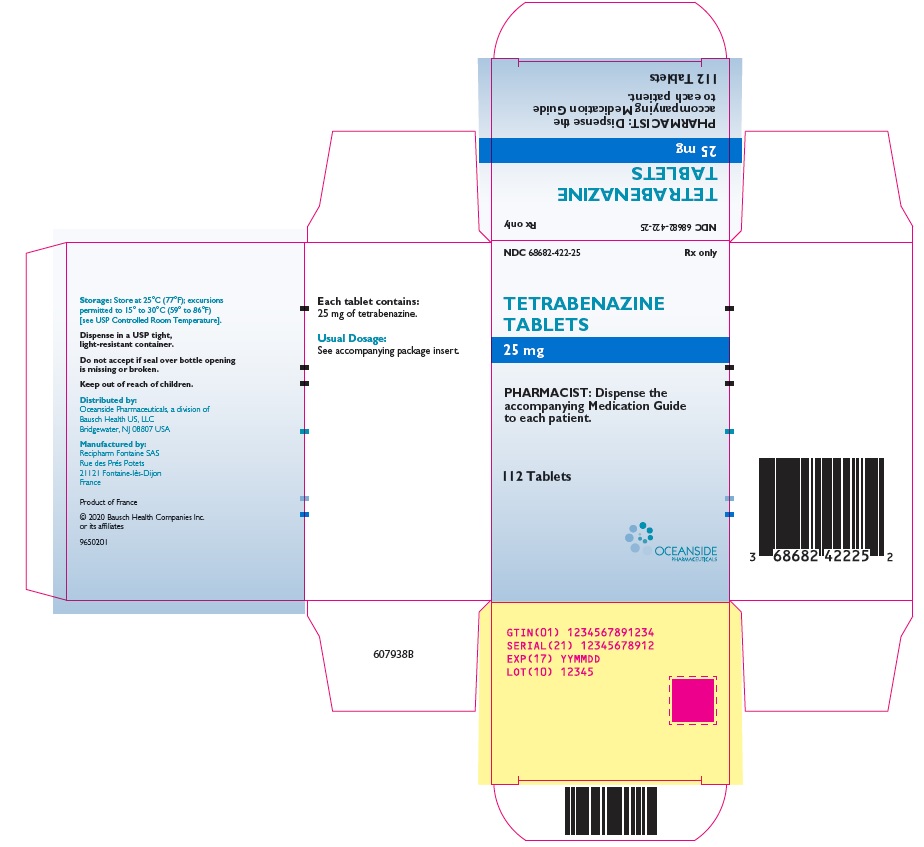
Carton-25mg.jpg (Carton 25mg)

Carton-25mg.jpg (Carton 25mg)
Packaging label for tetrabenazine tablets 25 mg, oral dosage form by Oceanside Pharmaceuticals. The label states 112 tablets per container and instructs pharmacists to dispense the accompanying medication guide. Storage and manufacturing information is included, noting manufacturing in France and storage at 25°C with excursions permitted. Barcodes and various identifiers appear on the label.*
FDA Label Image

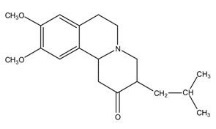
Chemical Structure (Image 01)

Chemical Structure (Image 01)
Chemical structure of tetrabenazine, showing its molecular arrangement including multiple ring systems and functional groups consistent with its known composition.*
FDA Label Image

Figure 1 (Xenazine 02)

Figure 1 (Xenazine 02)
A line graph showing chorea score change over a 14-week study period for tetrabenazine compared to placebo. The x-axis represents study weeks, and the y-axis shows chorea score change. Two lines illustrate tetrabenazine and placebo results, with tetrabenazine showing a greater decrease in chorea score. Error bars indicate variability, and participant numbers per week appear below the x-axis.*
FDA Label Image

Figure 2 (Xenazine 03)

Figure 2 (Xenazine 03)
A line graph comparing cumulative percentages of patients based on the change from baseline in chorea scores for tetrabenazine and placebo groups. The x-axis shows the change from baseline in chorea score, while the y-axis represents the cumulative percentage of patients. Vertical lines mark 3, 6, and 10-point changes.*

* About these descriptions: Image descriptions on this page are generated by automated AI analysis of the product label images from the manufacturer's FDA label submission (SPL). They are provided for reference only and may contain errors or omissions. Always rely on the printed label itself and the official FDA labeling, and consult a pharmacist or healthcare professional with any questions about this product.