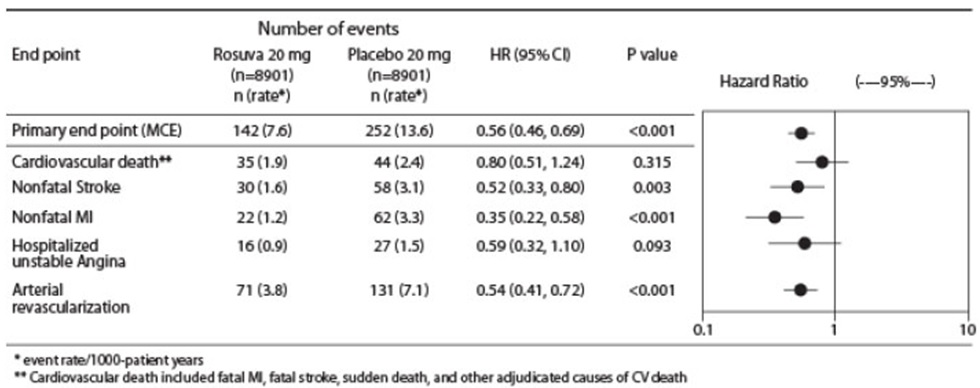
Figure-01 (Figure 1)
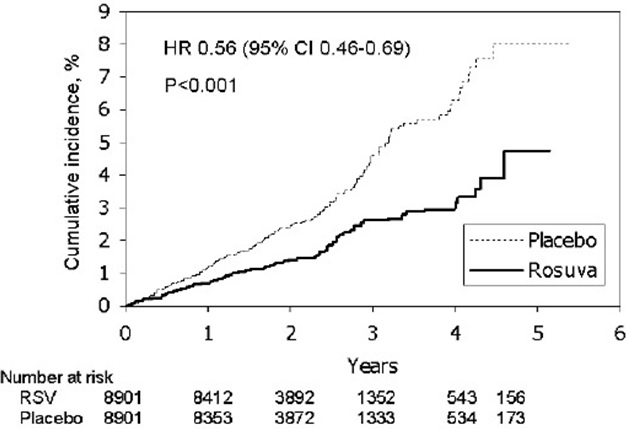
This is data from a study comparing an intervention (RSV) with a control group (Placebo). The numbers represent the number of individuals at risk over the years in each group. The values in the parentheses indicate the estimated effect size with a 95% confidence interval. The statistical significance is indicated by the p-value (P<0.001), suggesting a significant difference between the two groups.*