Product Images Tamsulosin Hydrochloride

View Photos of Packaging, Labels & Appearance

Product Label Images

The following 7 images provide visual information about the product associated with Tamsulosin Hydrochloride NDC 68788-7050 by Preferred Pharmaceuticals, Inc., such as packaging, labeling, and the appearance of the drug itself. This resource could be helpful for medical professionals, pharmacists, and patients seeking to verify medication information and ensure they have the correct product.

Figure 1 Mean Plasma Tamsulosin Hydrochloride Concentrations Following Single-Dose Administration of Tamsulosin Hydrochloride Capsules 0.4 mg Under Fasted and Fed Conditions (n=8) - tamsulosin fig1

Figure 1 Mean Plasma Tamsulosin Hydrochloride Concentrations Following Single-Dose Administration of Tamsulosin Hydrochloride Capsules 0.4 mg Under Fasted and Fed Conditions (n=8) - tamsulosin fig1

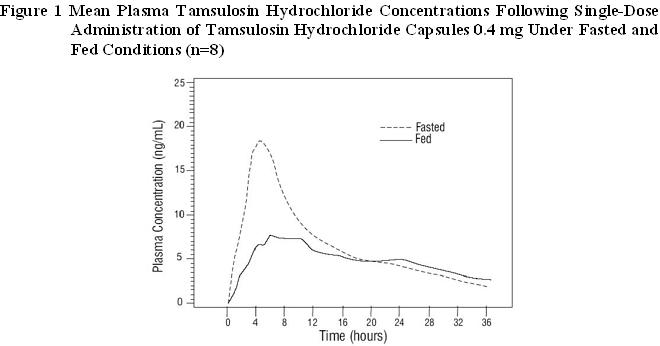
This is a graph (Figure 1) showing the mean plasma concentration of Tamsulosin Hydrochloride Capsules 0.4mg over time, following single-dose administration under fasted and fed conditions. The X-axis shows the time in hours, while the Y-axis shows the concentration of Tamsulosin Hydrochloride. The blue line represents the concentration under fasted conditions, and the red line represents the concentration under fed conditions. There is no other readable text to provide additional information.*

Figure 2A Mean Change from Baseline in Total AUA Symptom Score (0 to 35) Study 1 - tamsulosin fig2

Figure 2A Mean Change from Baseline in Total AUA Symptom Score (0 to 35) Study 1 - tamsulosin fig2

Figure 2B Mean Change from Baseline in Total AUA Symptom Score (0 to 35) Study 2 - tamsulosin fig3

Figure 2B Mean Change from Baseline in Total AUA Symptom Score (0 to 35) Study 2 - tamsulosin fig3

Figure 2B shows the mean change in total AUA symptom score from baseline in Study 2. The graph displays the duration of treatment in weeks and the three treatment groups, including O-O8mg LNt, 0.4mg, and Placebo. The x-axis indicates the time points at 0, 1, 2, 5, 9, 13, and LOCF, while the y-axis shows the mean change in the score from baseline (ranging from 0 to 35). It is not possible to interpret the graph without additional context, which is not provided in the given text.*

Figure 3A Mean Increase in Peak Urine Flow Rate (mL/Sec) Study 1 - tamsulosin fig4

Figure 3A Mean Increase in Peak Urine Flow Rate (mL/Sec) Study 1 - tamsulosin fig4

This is a visualization labeled as "Figure 3A" which shows the mean increase in peak urine flow rate (measured in L/Sec) in the course of a clinical study. The chart displays four columns, each representing a different treatment condition (0.08mg, 0.2mg, 0.4mg, and placebo), and the duration of the treatment is measured in weeks. The change in urine flow rate is measured in mL/sec and is displayed on the vertical axis. The horizontal axis spans from 7 to 13 weeks, and there are n=635, n=621, n=617, and n=754 observations for the treatment conditions, respectively.*

Figure 3B Mean Increase in Peak Urine Flow Rate (mL/Sec) Study 2 - tamsulosin fig5

Figure 3B Mean Increase in Peak Urine Flow Rate (mL/Sec) Study 2 - tamsulosin fig5

This text appears to be a figure caption related to a scientific study. It indicates the mean increase in peak urine flow rate (in mL/Sec) in Study 2. The figure shows data related to the treatment provided for 20 individuals. However, due to the lack of context or additional information, it is difficult to draw any firm conclusions about the study's nature or findings.*

Tamsulosin Hydrochloride Capsules USP 04mg - tamsulosin fig6

Tamsulosin Hydrochloride Capsules USP 04mg - tamsulosin fig6

This text appears to be a description and warning label for capsules containing Tamsulosin Hydrochloride, a generic medication for Flomax. The label includes information about the dosage (0.4mg), the manufacturer (Aurobindo Pharma Limited), and the product code (NDC). However, the quality is poor and there are several typos and missing characters, making it difficult to obtain a clear and accurate description.*

Chemical Structure - tamsulosin str

Chemical Structure - tamsulosin str

* The product label images have been analyzed using a combination of traditional computing and machine learning techniques. It should be noted that the descriptions provided may not be entirely accurate as they are experimental in nature. Use the information in this page at your own discretion and risk.