Product Images Aripiprazole

View Photos of Packaging, Labels & Appearance

Product Label Images

The following 13 images provide visual information about the product associated with Aripiprazole NDC 68788-7063 by Preferred Pharmaceuticals Inc., such as packaging, labeling, and the appearance of the drug itself. This resource could be helpful for medical professionals, pharmacists, and patients seeking to verify medication information and ensure they have the correct product.

AripiprazoleTablets 20mg - image containerlabel 20

AripiprazoleTablets 20mg - image containerlabel 20

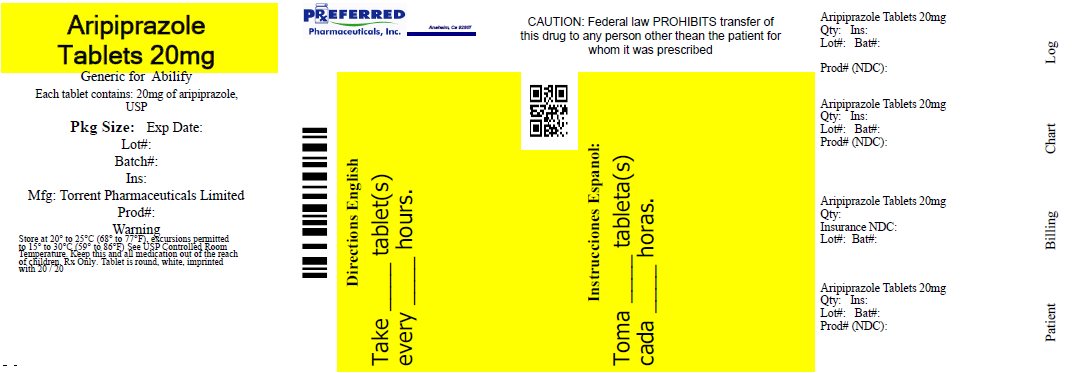
This is a medication description for Aripiprazole Tablets 20mg, which is the generic version of Abilify. Each tablet contains 20mg of arpiprazole, and it is manufactured by Torrent Pharmaceuticals Limited. The instructions for use are not available in the text, but there is a cautionary statement that federal law prohibits the transfer of this drug to anyone other than the patient for whom it was prescribed. The rest of the text is mostly product and manufacturing information such as production number, lot number, and NDC number.*

Image 1 - image fig1 effectofotherdrug arip

Image 1 - image fig1 effectofotherdrug arip

Image 2 - image fig2 effectofotherdrug dehydroarip

Image 2 - image fig2 effectofotherdrug dehydroarip

Figure 2 shows the impact of other drugs on the pharmacokinetics of Dehydro-Aripiprazole. The fold change and its 90% confidence interval of Dehydro-Aripiprazole is displayed. The effects of drugs such as Cypaps, aundne, a, Pt, et, gastric beckars, oner, and ariose are represented in the chart. There is also a percentage change relative to the reference shown.*

image 3 - image fig3 effectofarip otherdrug

image 3 - image fig3 effectofarip otherdrug

This is a table that shows the effect of aripiprazole on the pharmacokinetics of various other drugs. The table shows different drugs such as deropmetoptan, cvpace, artann, omeprazole, lamotigine, valproate, lithium, lorazepam, venidaine, odesmyhenataing, and escitiopram and their fold change and 50% CI when administered with aripiprazole. The table also shows the change relative to reference (without interacting drug) and different percentages from 5 to 30.*

Image 4 - image fig4 effectofintrinsicfactor arip

Image 4 - image fig4 effectofintrinsicfactor arip

The text describes the effects of intrinsic factors on the pharmacokinetics of the drug aripiprazole. The text includes information on the fold change and 90% confidence interval of the drug in special populations based on factors such as metabolism, gender, hepatic impairment, and renal impairment. The text provides graphs displaying the change relative to reference of the drug in various populations.*

image 5 - image fig5 effectofintrinsicfactor dehydroarip

image 5 - image fig5 effectofintrinsicfactor dehydroarip

This is a table showing the effects of different intrinsic factors on the pharmacokinetics of dehydro-aripiprazole. The factors evaluated include CYP2D6 metabolizer status, gender, age, hepatic impairment, and renal impairment. The table shows the fold change and confidence interval for AUC and Cmax at different levels of each factor compared to a reference.*

fig 6 - image fig6 schizophreniastudy 5

fig 6 - image fig6 schizophreniastudy 5

This is a graph (Figure 6) of the Kaplan-Meier estimation of cumulative proportion of patients with relapse for Schizophrenia Study 5. The graph compares the results of Aripiprazole and Placebo. The X-axis represents the number of days from randomization, and the Y-axis represents the cumulative proportion of patients with relapse. The graph also includes a table showing the number of subjects at risk for each treatment arm. This information could be useful to analyze the effectiveness of Aripiprazole in reducing relapse in patients with schizophrenia.*

7 - image fig7 bipolarstudy 7

7 - image fig7 bipolarstudy 7

This is a statistical analysis of a bipolar study, with Figure 7 presenting the Kaplan-Meier Estimation of the cumulative proportion of patients with relapse. The graph compares the results of the study for Aripiprazole against Placebo over the course of several days from randomization. The graph shows the reduction in the number of subjects at risk over time for each drug.*

8 - image fig8 bipolarstudy 8

8 - image fig8 bipolarstudy 8

This is a graph (Figure 8) that shows the Kaplan-Meier Estimation of the cumulative proportion of patients who have relapsed to any mood event in a bipolar study (Bipolar Study 8). The x-axis indicates the number of days from randomization, and the y-axis shows the proportion with relapse. The data points represent two treatment groups: ABILIFY (168 patients) and LACE 169 (77 patients).*

9 - image fig9 tourettesdisorderstudy1

9 - image fig9 tourettesdisorderstudy1

This is a graph showing the least square means of change in YGTSS TTS by week for Tourette's Disorder Study 1. The text also includes a table of values for the change in YGTSS total tic score from baseline, categorized by weeks of treatment. Therefore, the text provides data on the effectiveness of treatment on reducing tics in Tourette's disorder.*

Image - image logo medguide

Image - image logo medguide

logo - image logo pi

logo - image logo pi

description image - image structure

description image - image structure

* The product label images have been analyzed using a combination of traditional computing and machine learning techniques. It should be noted that the descriptions provided may not be entirely accurate as they are experimental in nature. Use the information in this page at your own discretion and risk.