Figure 1. Mean Change From Baseline For Hba1c In A 26-week Placebo-controlled Dose-ranging Study (observed Values) (Pioglitazone Fig1)
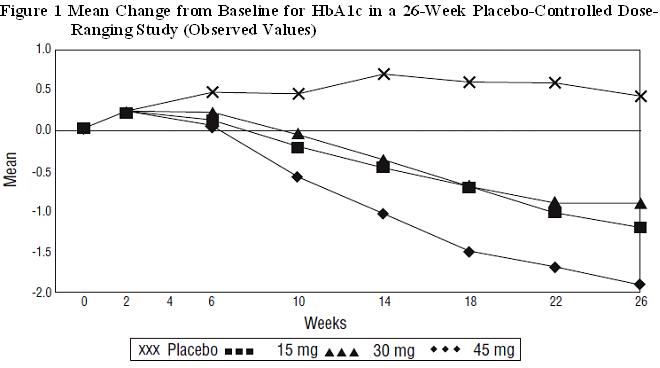
The text describes a figure in a 26-week study that shows the mean change from baseline for HbAlc in a dose-ranging experiment. The experiment was placebo-controlled and the figure shows the observed values. The X-axis shows the duration of the study in weeks, while the Y-axis shows the mean change from baseline for HbAlc. The figure displays three dosage levels (15mg, 30mg, 45mg) and illustrates how the HbAlc changes from baseline.*

