Pregabalin Capsule
Product Images NDC 68788-7522

View Photos of Packaging, Regulatory Labels, and Product Appearance

Product Visual Gallery

This gallery contains 14 technical images submitted to the FDA as part of the official labeling for Pregabalin (NDC 68788-7522). Unlike standard consumer photos, these assets often include clinical data figures, molecular chemical structures, and official manufacturer packaging layouts.

As provided by Preferred Pharmaceuticals, Inc., these visuals offer a comprehensive scientific overview of the product's physical and chemical identity, aiding pharmacists and researchers in product verification and study.

FDA Label Image

Pregabalin Caps 75mg 30s Count

Pregabalin Caps 75mg 30s Count
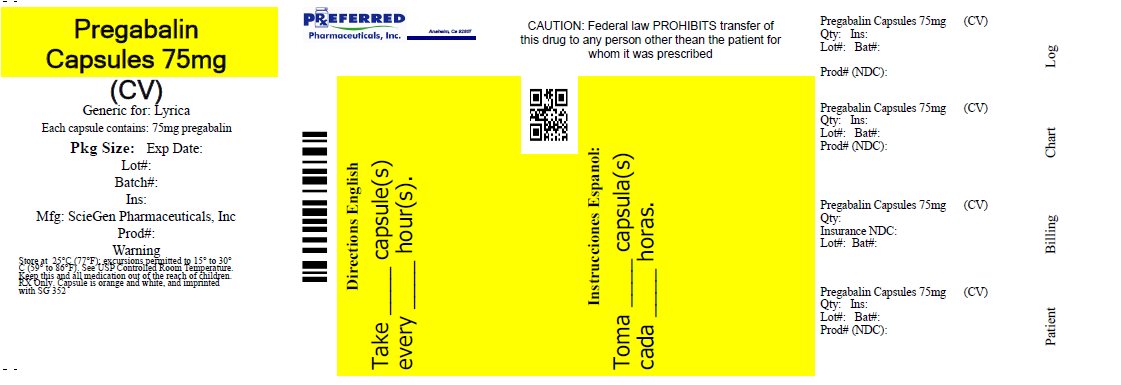
The text represents information related to a medication called Pregabalin Capsules 75mg. The medication is a generic version of Lyrica and is produced by ScieGen Pharmceuticals Inc. Each capsule contains 75mg of pregabalin and is for oral use. The text also warns that Federal Law prohibits the transfer of this medication without a prescription.*
FDA Label Image

Figure 1 (Pregabalin Fig01)

FDA Label Image

Figure 2 (Pregabalin Fig02)

FDA Label Image

Figure 3 (Pregabalin Fig03)

FDA Label Image

Figure 4 (Pregabalin Fig04)

FDA Label Image

Figure 5 (Pregabalin Fig05)

FDA Label Image

Figure 6 (Pregabalin Fig06)

FDA Label Image

Figure 7 (Pregabalin Fig07)

FDA Label Image

Figure 9 (Pregabalin Fig08)

Figure 9 (Pregabalin Fig08)
The text presents a graph showing the percentage of patients who improved in pain in relation to the daily doses of Pregabalin (300mg and 450mg) compared to Placebo. The x-axis shows the percentage of improvement from baseline and the y-axis shows the different treatments. However, there is no information on what condition or disease is being treated, making it difficult to provide more context other than showing the effectiveness of Pregabalin in improving pain.*
FDA Label Image

Figure 10 (Pregabalin Fig09)

Figure 10 (Pregabalin Fig09)
This appears to be a graph showing the estimated percentage of subjects without LTR (not sure what this stands for) over a period of 120 days. One line on the graph represents a group that received Progabain and the other line represents a placebo group. The x-axis shows the number of days from 0 to 120 with some numbers missing, and the y-axis shows the percentage from 0 to 100 with tick marks at every 10.*
FDA Label Image

Figure 11 (Pregabalin Fig10)

FDA Label Image

Figure 12 (Pregabalin Fig11)

Figure 12 (Pregabalin Fig11)
Percent of subjects improved is being reported, with a specific percentage of improvement noted from Bassine to Week 16 being 80%. There is also a mention of "Presueuin Pcein". However, as the text is not clear and appears to be gibberish, the meaning or relevance of the mentioned term is not available.*
FDA Label Image

Cockcroft And Gault Equation (Pregabalin Formula)

Cockcroft And Gault Equation (Pregabalin Formula)
This is a formula for estimating the creatinine clearance rate (CLCT) in patients. CLCT is calculated by subtracting the patient's age in years, multiplied by 140, from their weight in kilograms, and then multiplied by their serum creatinine level in mg/dL. For female patients, the result is multiplied by 0.85.*
FDA Label Image

Chemical Structure (Pregabalin Str)

* These product label images have been analyzed using experimental machine learning. Please verify findings with the primary label text.