Pregabalin Capsule
Product Images NDC 68788-7523

View Photos of Packaging, Regulatory Labels, and Product Appearance

Product Visual Gallery

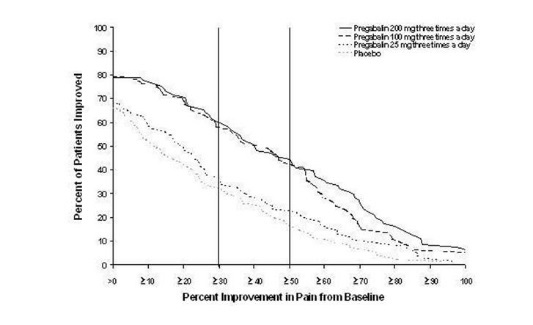
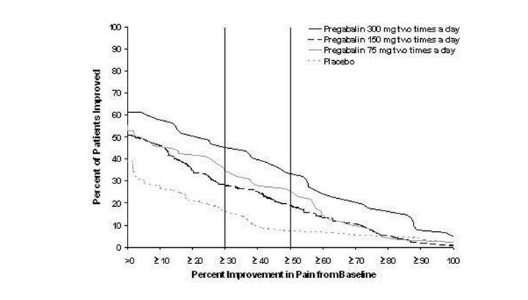
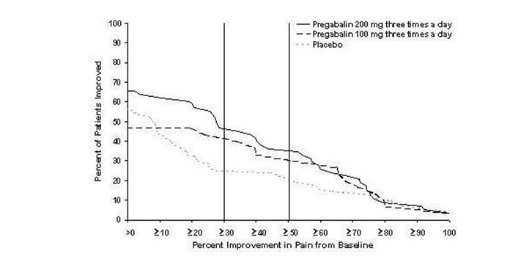
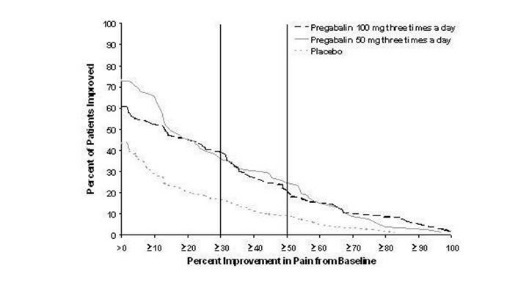
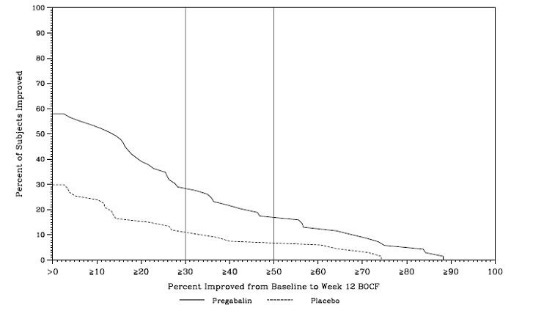
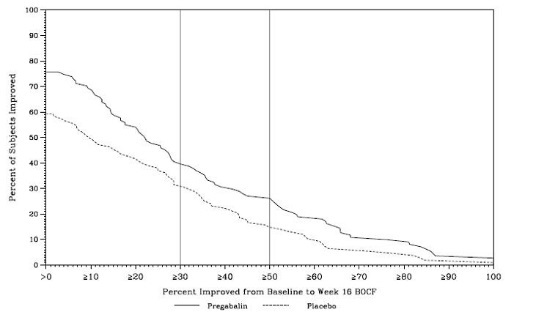
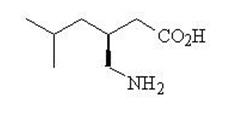
This gallery contains 14 technical images submitted to the FDA as part of the official labeling for Pregabalin (NDC 68788-7523). Unlike standard consumer photos, these assets often include clinical data figures, molecular chemical structures, and official manufacturer packaging layouts.

As provided by Preferred Pharmaceuticals, Inc., these visuals offer a comprehensive scientific overview of the product's physical and chemical identity, aiding pharmacists and researchers in product verification and study.

FDA Label Image

3da23e7c A3be 46cb B403 Da4fb78019db 00

FDA Label Image

Figure 1 (Pregabalin Fig01)

FDA Label Image

Figure 2 (Pregabalin Fig02)

FDA Label Image

Figure 3 (Pregabalin Fig03)

FDA Label Image

Figure 4 (Pregabalin Fig04)

FDA Label Image

Figure 5 (Pregabalin Fig05)

FDA Label Image

Figure 6 (Pregabalin Fig06)

FDA Label Image

Figure 7 (Pregabalin Fig07)

FDA Label Image

Figure 9 (Pregabalin Fig08)

Figure 9 (Pregabalin Fig08)
The text shows a graph with the percentage of patients improved in relation to the dosage of Pregabalin, a medication commonly used to treat pain and seizures. The graph demonstrates that patients using higher dosage (450mg) experience a higher rate of improvement in pain compared to those using a lower dosage (300mg) or placebo. The X-axis shows the range of percentage improvement in pain from baseline, while the Y-axis indicates the percentage of patients improved.*
FDA Label Image

Figure 10 (Pregabalin Fig09)

Figure 10 (Pregabalin Fig09)
The text seems to be a chart displaying the estimated percentage of subjects without LTR (which is not mentioned in the given text) over a period of 120 days, with two different treatments: Progabain and Placebo. The estimated percentages range from 0% to 100%, with increments of 10%. The numbers at the bottom indicate the number of days in the treatment.*
FDA Label Image

Figure 11 (Pregabalin Fig10)

FDA Label Image

Figure 12 (Pregabalin Fig11)

Figure 12 (Pregabalin Fig11)
Percent of subjects improved is being presented in the given text. However, it does not provide any further information or context to understand the scope, purpose or relevance of this information.*
FDA Label Image

Cockcroft And Gault Equation (Pregabalin Formula)

Cockcroft And Gault Equation (Pregabalin Formula)
This appears to be a medical formula for calculating CLCT (creatinine clearance using the Cockcroft-Gault formula) in adult patients. The formula involves subtracting the patient's age (in years) from 140, multiplying the result by their weight in kilograms, and then multiplying that value by 0.85 if the patient is female. The final step is to multiply 72 by the patient's serum creatinine level in milligrams per deciliter (mg/dL).*
FDA Label Image

Chemical Structure (Pregabalin Str)

* These product label images have been analyzed using experimental machine learning. Please verify findings with the primary label text.