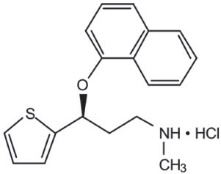
Product Images Duloxetine Delayed-release

View Photos of Packaging, Labels & Appearance

Product Label Images

The following 11 images provide visual information about the product associated with Duloxetine Delayed-release NDC 68788-7897 by Preferred Pharmaceuticals Inc., such as packaging, labeling, and the appearance of the drug itself. This resource could be helpful for medical professionals, pharmacists, and patients seeking to verify medication information and ensure they have the correct product.

Duloxetine Delayed Release Cap. USP 20mg

Duloxetine Delayed Release Cap. USP 20mg

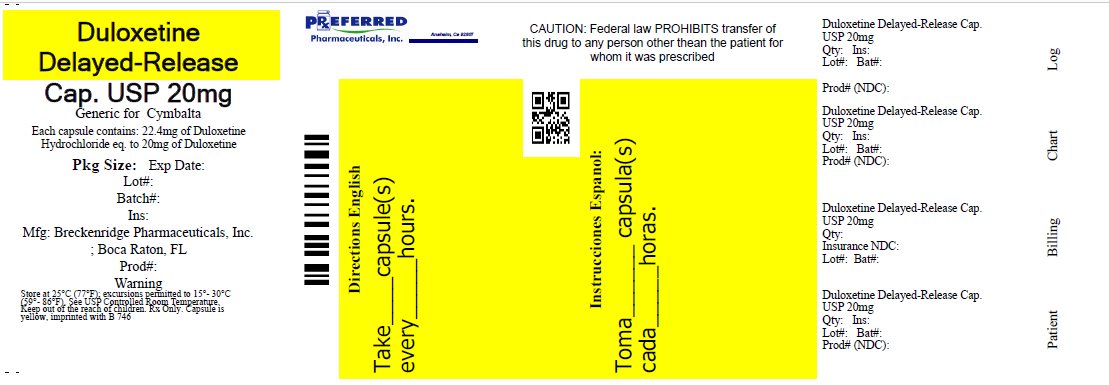
This appears to be the label information for a medication called Duloxetine, with a warning about federal law and contents of each capsule, as well as information about the packaging and expiration date. However, there are several spelling errors and unclear formatting, making it difficult to determine specific details about the medication.*

Chemical Structure - duloxetine 01

Chemical Structure - duloxetine 01

Figure 1 - duloxetine 02

Figure 1 - duloxetine 02

Figure 2 - duloxetine 03

Figure 2 - duloxetine 03

The text describes a graph that shows the proportion of patients who experienced a relapse over time (in days) after being randomized for some type of treatment. The treatments mentioned in the text are Plocab and Duloxetine.*

Figure 3 - duloxetine 04

Figure 3 - duloxetine 04

Figure 4 - duloxetine 05

Figure 4 - duloxetine 05

Figure 5 - duloxetine 06

Figure 5 - duloxetine 06

Figure 6 - duloxetine 07

Figure 6 - duloxetine 07

Figure 8 - duloxetine 08

Figure 8 - duloxetine 08

Figure 9 - duloxetine 09

Figure 9 - duloxetine 09

This appears to be a graph displaying the percentage of patients who experienced improvement in pain after a certain treatment. The graph shows an x-axis with values ranging from 1w to b0 and a y-axis with values ranging from 20 to 100. The title of the y-axis indicates that it represents percent improvement in pain from baseline according to the BOCF method. Unfortunately, without further context or legible labels, it is not possible to determine what the treatment or condition being treated is or what the specific data points on the graph represent.*

Figure 10 - duloxetine 10

Figure 10 - duloxetine 10

* The product label images have been analyzed using a combination of traditional computing and machine learning techniques. It should be noted that the descriptions provided may not be entirely accurate as they are experimental in nature. Use the information in this page at your own discretion and risk.