Donepezil Hydrochloride Tablet, Film Coated
Product Images NDC 68788-8208

View Photos of Packaging, Regulatory Labels, and Product Appearance

Product Visual Gallery

This gallery contains 15 technical images submitted to the FDA as part of the official labeling for Donepezil Hydrochloride (NDC 68788-8208). Unlike standard consumer photos, these assets often include clinical data figures, molecular chemical structures, and official manufacturer packaging layouts.

As provided by Preferred Pharmaceuticals Inc., these visuals offer a comprehensive scientific overview of the product's physical and chemical identity, aiding pharmacists and researchers in product verification and study.

FDA Label Image

Donepezil HCl Tablets 5mg (8138f616 83f3 4c47 84ef 1bce2db339f7 00)

Donepezil HCl Tablets 5mg (8138f616 83f3 4c47 84ef 1bce2db339f7 00)
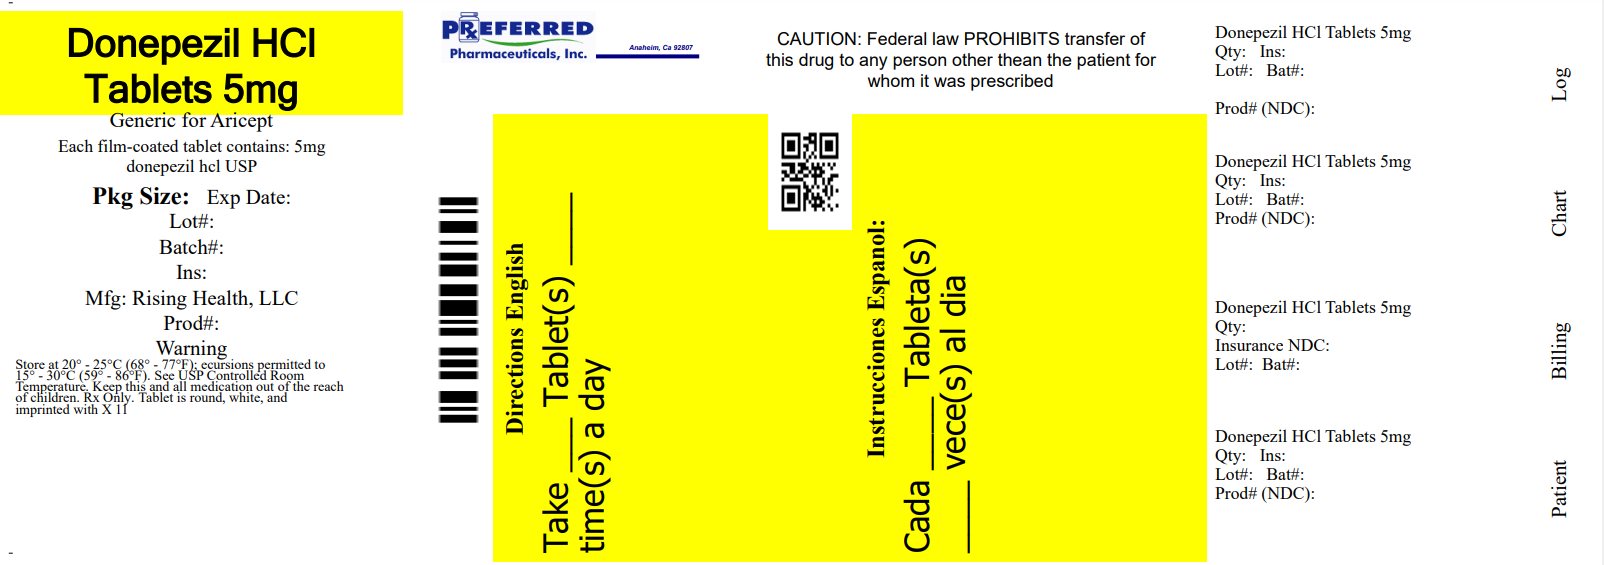
This is a description of a medication called Donepezil HCI Tablets 5mg, which is the generic brand of Aricept. The tablets are prescribed for patients suffering from certain medical conditions. The description includes information on the manufacturer, package size, lot number, expiration date, and warning on keeping the medication out of reach of children. There is also a mention of a billing chart log, likely for record-keeping purposes.*
FDA Label Image

Figure 1. Time-course Of The Change From Baseline In Adas-cog Score For Patients Completing 24 Weeks Of Treatment. (Donepezil Fig1)

FDA Label Image

Figure 10. Cumulative Percentage Of Patients Completing 6 Months Of Double-blind Treatment With Particular Changes From Baseline In Adcs-adl-severe Scores. (Donepezil Fig10)

Figure 10. Cumulative Percentage Of Patients Completing 6 Months Of Double-blind Treatment With Particular Changes From Baseline In Adcs-adl-severe Scores. (Donepezil Fig10)
This is a graph that shows the cumulative percentage of patients who were given either 10 mg/day of donepezil hydrochloride or a placebo drug. The X-axis displays the change in ADCS-ADL (Alzheimer's Disease Cooperative Study-Activities of Daily Living) from baseline, while the Y-axis shows the percentage of patients who showed improvement or decline. The line representation of donepezil is marked with "e" and the placebo with "o". The graph indicates that donepezil hydrochloride performed better than placebo in terms of the percentage of patients who experienced improvement.*
FDA Label Image

Figure 11. Time-course Of The Change From Baseline In Sib Score For Patients Completing 24 Weeks Of Treatment. (Donepezil Fig11)

FDA Label Image

Figure 12. Cumulative Percentage Of Patients Completing 24 Weeks Of Double-blind Treatment With Specified Changes From Baseline Sib Scores. (Donepezil Fig12)

Figure 12. Cumulative Percentage Of Patients Completing 24 Weeks Of Double-blind Treatment With Specified Changes From Baseline Sib Scores. (Donepezil Fig12)
The text appears to be a graph or chart without any labels, titles, or context. It is not possible to provide a useful description with only this information.*
FDA Label Image

Figure 13. Frequency Distribution Of Cibic-plus Scores At Week 24. (Donepezil Fig13)

FDA Label Image

Figure 2. Cumulative Percentage Of Patients Completing 24 Weeks Of Double-blind Treatment With Specified Changes From Baseline Adas-cog Scores. The Percentages Of Randomized Patients Who Completed The Study Were: Placebo 80%, 5 mg/day 85%, And 10 mg/day 68%. (Donepezil Fig2)

FDA Label Image

Figure 3. Frequency Distribution Of Cibic-plus Scores At Week 24. (Donepezil Fig3)

FDA Label Image

Figure 4. Time-course Of The Change From Baseline In Adas-cog Score For Patients Completing The 15-week Study. (Donepezil Fig4)

FDA Label Image

Figure 5. Cumulative Percentage Of Patients With Specified Changes From Baseline Adas-cog Scores. The Percentages Of Randomized Patients Within Each Treatment Group Who Completed The Study Were: Placebo 93%, 5 mg/day 90%, And 10 mg/day 82%. (Donepezil Fig5)

FDA Label Image

Figure 6. Frequency Distribution Of Cibic-plus Scores At Week 12. (Donepezil Fig6)

Figure 6. Frequency Distribution Of Cibic-plus Scores At Week 12. (Donepezil Fig6)
This is a table displaying the results of a clinical trial for Donepezil Hydrochloride, a medication used to treat Alzheimer's disease. The table shows the percentage of patients who showed improvement in their CIBIC-plus Rating, a measure of cognitive and functional ability, after taking either Donepezil Hydrochloride or a placebo. The table also shows the level of improvement (moderately, minimally, or markedly) and the percentage of patients who got worse.*
FDA Label Image

Figure 7. Time Course Of The Change From Baseline In Sib Score For Patients Completing 6 Months Of Treatment. (Donepezil Fig7)

Figure 7. Time Course Of The Change From Baseline In Sib Score For Patients Completing 6 Months Of Treatment. (Donepezil Fig7)
This text represents a chart or graph showing the change in SIB (Severe Impairment Battery) scores from baseline, with mean values and standard error for patients treated with donepezil hydrochloride 10 mg/day and those treated with a placebo, after 3 months of drug treatment. The chart suggests that donepezil hydrochloride treatment may lead to clinical improvement in patients with the condition being studied.*
FDA Label Image

Figure 8. Cumulative Percentage Of Patients Completing 6 Months Of Double-blind Treatment With Particular Changes From Baseline In Sib Scores. (Donepezil Fig8)

Figure 8. Cumulative Percentage Of Patients Completing 6 Months Of Double-blind Treatment With Particular Changes From Baseline In Sib Scores. (Donepezil Fig8)
This is a graph showing the cumulative percentage of patients on Donepezil Hydrochloride 10mg/day and Placebo. The SIB (Severe Impairment Battery) change from the baseline is also shown on the graph in percentages. The X-axis of the graph measures the time in weeks while the Y-axis shows the percentage change.*
FDA Label Image

Figure 9. Time Course Of The Change From Baseline In Adcs-adl-severe Score For Patients Completing 6 Months Of Treatment. (Donepezil Fig9)

FDA Label Image

Chemical Structure (Donepezil Str)

* These product label images have been analyzed using experimental machine learning. Please verify findings with the primary label text.