Divalproex Sodium Tablet, Extended Release
Product Images NDC 68788-8358

View Photos of Packaging, Regulatory Labels, and Product Appearance

Product Visual Gallery

This gallery contains 5 technical images submitted to the FDA as part of the official labeling for Divalproex Sodium (NDC 68788-8358). Unlike standard consumer photos, these assets often include clinical data figures, molecular chemical structures, and official manufacturer packaging layouts.

As provided by Preferred Pharmaceuticals, Inc., these visuals offer a comprehensive scientific overview of the product's physical and chemical identity, aiding pharmacists and researchers in product verification and study.

FDA Label Image

Divalproex Sodium Er Tab 500mg (83a77f60 Ed58 4fa0 A584 E6a0c767d19d 00)

Divalproex Sodium Er Tab 500mg (83a77f60 Ed58 4fa0 A584 E6a0c767d19d 00)
Label for Divalproex Sodium ER Tab 500 mg extended release oral tablets, generic for Depakote ER. The label includes the drug name, strength, generic status, and manufacturer Lupin Pharmaceuticals, Inc. It also has cautionary federal law text, storage instructions, and space for lot and batch numbers. The label features bilingual directions in English and Spanish on a yellow background and a barcode.*
FDA Label Image

Image 1 (D95f9b1b F1e4 4ae4 A215 7317fb1ca565 01)

Image 1 (D95f9b1b F1e4 4ae4 A215 7317fb1ca565 01)
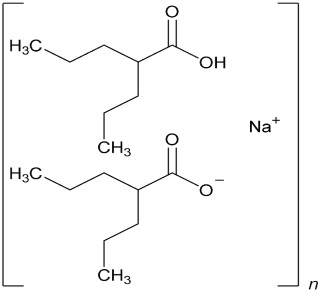
Chemical structure diagram depicting the molecular arrangement of divalproex sodium, illustrating the components and bonding within the compound.*
FDA Label Image

Image 2 (D95f9b1b F1e4 4ae4 A215 7317fb1ca565 02)

Image 2 (D95f9b1b F1e4 4ae4 A215 7317fb1ca565 02)
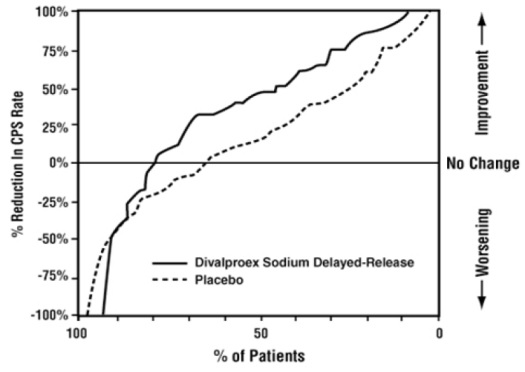
A cumulative response curve chart comparing Divalproex Sodium Delayed-Release and placebo showing percentage of patients on the horizontal axis versus percentage reduction in CPS rate on the vertical axis, indicating improvement or worsening in patient response.*
FDA Label Image

Image 3 (D95f9b1b F1e4 4ae4 A215 7317fb1ca565 03)

Image 3 (D95f9b1b F1e4 4ae4 A215 7317fb1ca565 03)
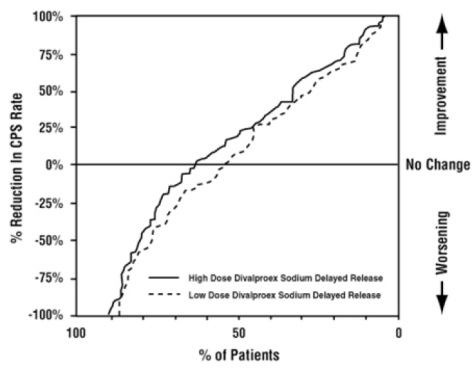
A cumulative distribution plot showing percent reduction in CPS rate on the vertical axis against percent of patients on the horizontal axis. Two curves represent high dose and low dose Divalproex Sodium Delayed Release, illustrating patient response in terms of symptom improvement or worsening.*
FDA Label Image

Image 4 (D95f9b1b F1e4 4ae4 A215 7317fb1ca565 04)

Image 4 (D95f9b1b F1e4 4ae4 A215 7317fb1ca565 04)
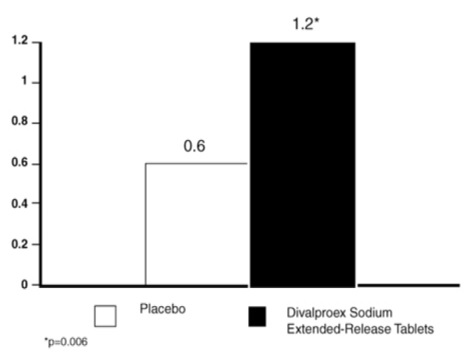
A bar graph comparing the effects of Placebo and Divalproex Sodium Extended-Release Tablets, showing a value of 0.6 for Placebo and 1.2 for Divalproex Sodium. The graph includes an asterisk indicating statistical significance with a p-value of 0.006.*

* About these descriptions: Image descriptions on this page are generated by automated AI analysis of the product label images from the manufacturer's FDA label submission (SPL). They are provided for reference only and may contain errors or omissions. Always rely on the printed label itself and the official FDA labeling, and consult a pharmacist or healthcare professional with any questions about this product.