Pregabalin Capsule
Product Images NDC 68788-8360

View Photos of Packaging, Regulatory Labels, and Product Appearance

Product Visual Gallery

This gallery contains 14 technical images submitted to the FDA as part of the official labeling for Pregabalin (NDC 68788-8360). Unlike standard consumer photos, these assets often include clinical data figures, molecular chemical structures, and official manufacturer packaging layouts.

As provided by Preferred Pharmaceuticals Inc., these visuals offer a comprehensive scientific overview of the product's physical and chemical identity, aiding pharmacists and researchers in product verification and study.

FDA Label Image

Schematic, Timelinedescription Automatically Generated (E8e272a4 C181 4573 822b 2bb315b6ad37 00)

Schematic, Timelinedescription Automatically Generated (E8e272a4 C181 4573 822b 2bb315b6ad37 00)
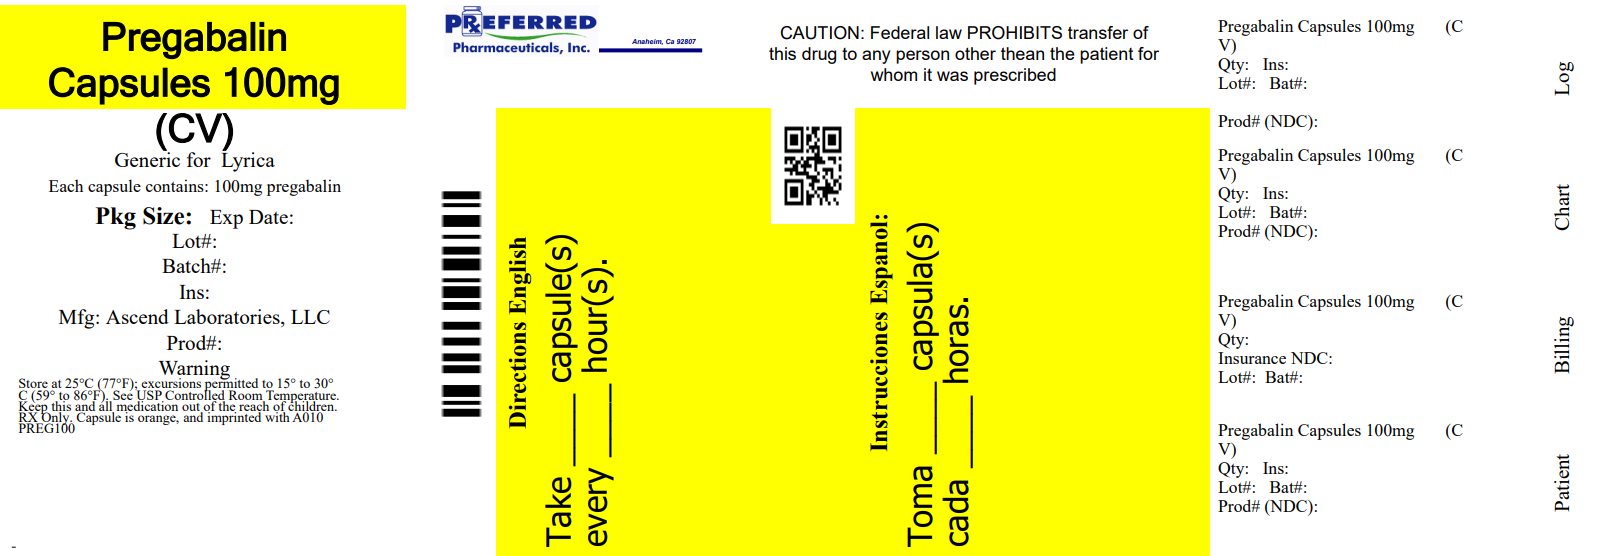
This is a pharmaceutical label for Pregabalin Capsules 100mg, a generic drug for Lyrica. It warns that federal law prohibits the transfer of this medication to any person other than the patient for whom it was prescribed. It also lists the manufacturer (Ascend Laboratories, LLC) and expiration date, production and batch numbers, and quantity. A billing chart log for the patient is also mentioned.*
FDA Label Image

Pregabalin-equation (Pregabalin Equation)

FDA Label Image

Pregabalin-figure-6 (Pregabalin Figure 6)

Pregabalin-figure-6 (Pregabalin Figure 6)
This appears to be a table summarizing the results of multiple studies evaluating the effectiveness of different doses of an unidentified medication compared to a placebo. The medication was studied in at least three different trials (E1, E3, and one not named) at doses ranging from 50mg/day to 600mg/day. The table reports the percentage change in some outcome variable (not specified) for each dose level, as well as the percentage change in the placebo group. One dose level (not specified) had a statistically significant effect compared to placebo.*
FDA Label Image

Pregabalin-figure-7 (Pregabalin Figure 7)

FDA Label Image

Study Dpn 1 (Pregabalin Image 1)

FDA Label Image

Study Sci 1 (Pregabalin Image 10)

FDA Label Image

Pain Intensity-study Sci 2 (Pregabalin Image 11)

FDA Label Image

Study Dpn 2 (Pregabalin Image 2)

FDA Label Image

Study Phn 1 (Pregabalin Image 3)

FDA Label Image

Study Phn 2 (Pregabalin Image 4)

FDA Label Image

Study Phn 3 (Pregabalin Image 5)

FDA Label Image

Fibromyalgia Study F1 (Pregabalin Image 8)

Fibromyalgia Study F1 (Pregabalin Image 8)
This appears to be a chart showing the percentage of patients who experienced improvement in pain from baseline after taking different doses of Pregabalin. The chart displays percentages ranging from 0% to 100%, with the largest percentage of patients experiencing improvement after taking a daily dose of 600mg.*
FDA Label Image

Fibromyalgia Study F2 (Pregabalin Image 9)

FDA Label Image

Pregabalin Structure (Pregabalin Srtuc 1)

* These product label images have been analyzed using experimental machine learning. Please verify findings with the primary label text.