Pregabalin Capsule
Product Images NDC 68788-8391

View Photos of Packaging, Regulatory Labels, and Product Appearance

Product Visual Gallery

This gallery contains 14 technical images submitted to the FDA as part of the official labeling for Pregabalin (NDC 68788-8391). Unlike standard consumer photos, these assets often include clinical data figures, molecular chemical structures, and official manufacturer packaging layouts.

As provided by Preferred Pharmaceuticals Inc., these visuals offer a comprehensive scientific overview of the product's physical and chemical identity, aiding pharmacists and researchers in product verification and study.

FDA Label Image

Pregabalin Capsules 75mg (A0da0534 B386 4c93 Ae89 03b0e3325e02 00)

Pregabalin Capsules 75mg (A0da0534 B386 4c93 Ae89 03b0e3325e02 00)
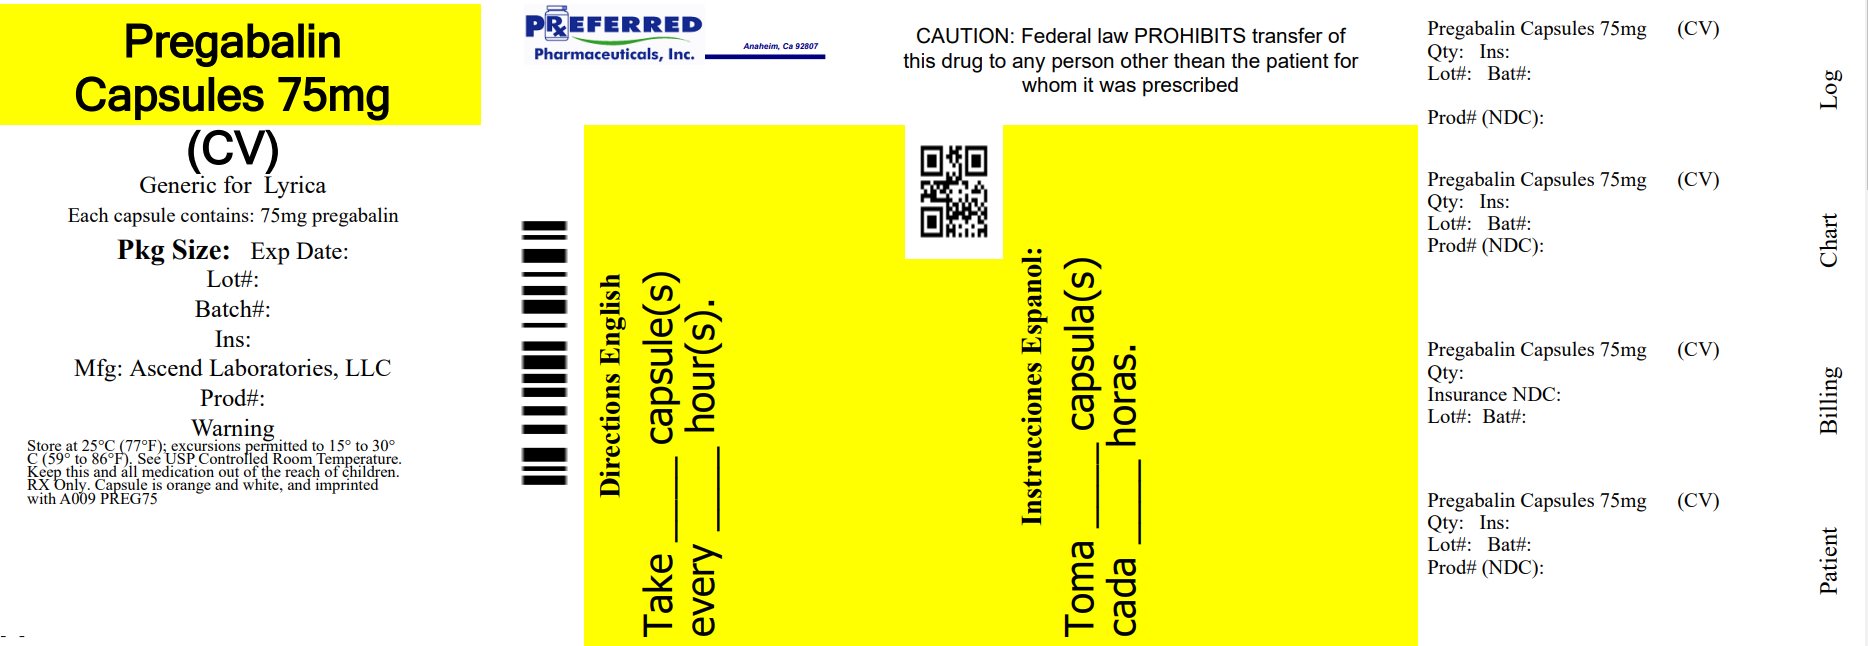
This is a description of a medication called Pregabalin, which is sold in 75mg capsules. The capsules are produced by Ascend Laboratories, LLC and are a generic version of the drug Lyrica. The package size and expiration date are not specified, but there are fields for the lot number, batch number and inscription. The medication must be kept in a controlled environment between 15-30°C. The capsules are orange and white, imprinted with "A009 PREG7S" and should be kept away from children. The directions are provided in English and indicate that the capsules should be taken at room temperature, at intervals specified by a doctor. A warning indicates that the medication should only be used by the person it was prescribed for, as per federal law. The rest of the text appears to be a chart log for billing purposes.*
FDA Label Image

Pregabalin-equation (Pregabalin Equation)

Pregabalin-equation (Pregabalin Equation)
This appears to be a formula for estimating creatinine clearance (CLCr) in female patients based on age, weight, and serum creatinine levels. However, without more context or information about the units, it is difficult to provide a more detailed description or analysis.*
FDA Label Image

Pregabalin-figure-6 (Pregabalin Figure 6)

Pregabalin-figure-6 (Pregabalin Figure 6)
This text appears to be a chart or table displaying results of different studies comparing the effectiveness of various doses of a medication versus a placebo. The medication was administered at varying doses (50mg/day, 150mg/day, 300mg/day, or 600mg/day). The results show the percentage change in a certain measurement (not specified) from the baseline value, as well as whether the change was statistically significant compared to the placebo group.*
FDA Label Image

Pregabalin-figure-7 (Pregabalin Figure 7)

FDA Label Image

Study Dpn 1 (Pregabalin Image 1)

FDA Label Image

Study Sci 1 (Pregabalin Image 10)

FDA Label Image

Pain Intensity-study Sci 2 (Pregabalin Image 11)

FDA Label Image

Study Dpn 2 (Pregabalin Image 2)

FDA Label Image

Study Phn 1 (Pregabalin Image 3)

FDA Label Image

Study Phn 2 (Pregabalin Image 4)

FDA Label Image

Study Phn 3 (Pregabalin Image 5)

FDA Label Image

Fibromyalgia Study F1 (Pregabalin Image 8)

FDA Label Image

Fibromyalgia Study F2 (Pregabalin Image 9)

FDA Label Image

Pregabalin Structure (Pregabalin Srtuc 1)

* These product label images have been analyzed using experimental machine learning. Please verify findings with the primary label text.