Gabapentin
Product Images NDC 68788-8475

View Photos of Packaging, Regulatory Labels, and Product Appearance

Product Visual Gallery

This gallery contains 6 technical images submitted to the FDA as part of the official labeling for Gabapentin (NDC 68788-8475). Unlike standard consumer photos, these assets often include clinical data figures, molecular chemical structures, and official manufacturer packaging layouts.

As provided by Preferred Pharmaceuticals Inc., these visuals offer a comprehensive scientific overview of the product's physical and chemical identity, aiding pharmacists and researchers in product verification and study.

FDA Label Image

Image (6827ca69 0e15 4426 94ae Cb5f94bdbe65 01)
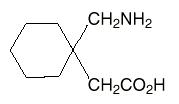
Image (6827ca69 0e15 4426 94ae Cb5f94bdbe65 01)
Chemical structure diagram depicting the molecular arrangement of gabapentin, showing its cyclohexane ring bonded to an amino group and a carboxyl group.*
FDA Label Image

Image (6827ca69 0e15 4426 94ae Cb5f94bdbe65 02)

Image (6827ca69 0e15 4426 94ae Cb5f94bdbe65 02)
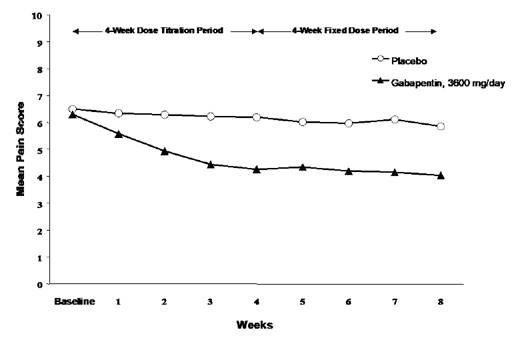
A line graph comparing the mean pain score over eight weeks between placebo and Gabapentin at a dose of 3600 mg/day. The graph includes a 4-week dose titration period followed by a 4-week fixed dose period, showing a decrease in pain score for the Gabapentin group compared to the placebo group over time.*
FDA Label Image

Image (6827ca69 0e15 4426 94ae Cb5f94bdbe65 03)

Image (6827ca69 0e15 4426 94ae Cb5f94bdbe65 03)
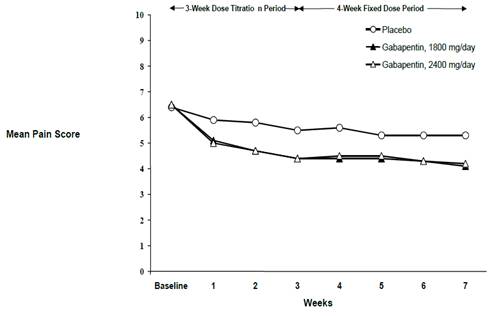
A line graph showing mean pain scores over seven weeks for three groups: placebo, Gabapentin 1800 mg/day, and Gabapentin 2400 mg/day. The x-axis represents weeks from baseline to week 7, and the y-axis shows the mean pain score. The graph indicates trends during a 3-week dose titration period followed by a 4-week fixed dose period.*
FDA Label Image

Image (6827ca69 0e15 4426 94ae Cb5f94bdbe65 04)

Image (6827ca69 0e15 4426 94ae Cb5f94bdbe65 04)
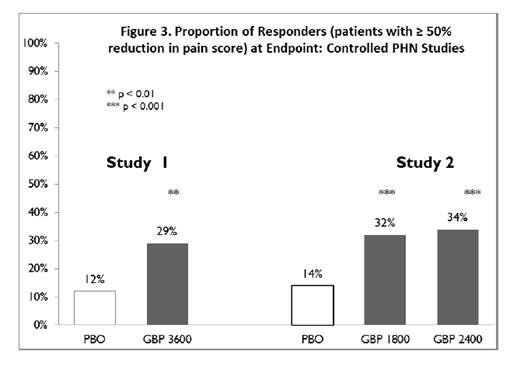
A bar chart titled 'Proportion of Responders (patients with ≥ 50% reduction in pain score) at Endpoint: Controlled PHN Studies' comparing placebo (PBO) and Gabapentin (GBP) treatment groups in two studies. The chart shows the percentage of responders for each group, highlighting statistically significant improvements with Gabapentin at doses of 1800, 2400, and 3600 compared to placebo.*
FDA Label Image

Image (6827ca69 0e15 4426 94ae Cb5f94bdbe65 05)

Image (6827ca69 0e15 4426 94ae Cb5f94bdbe65 05)
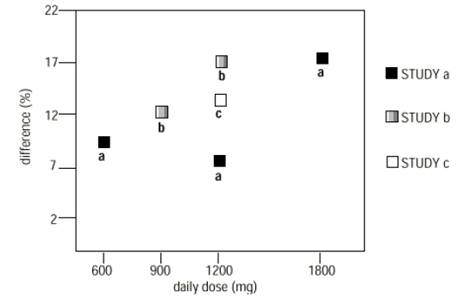
A scatter plot comparing percentage difference against daily doses (mg) of gabapentin in three studies labeled a, b, and c. The y-axis represents difference (%) ranging from 2 to 22, and the x-axis represents daily doses from 600 to 1800 mg. Data points are marked with different symbols for each study.*
FDA Label Image

Gabapentin Capsules Usp 400mg (B1c2f960 Fed4 428b B505 D038057ceb4f 00)

Gabapentin Capsules Usp 400mg (B1c2f960 Fed4 428b B505 D038057ceb4f 00)
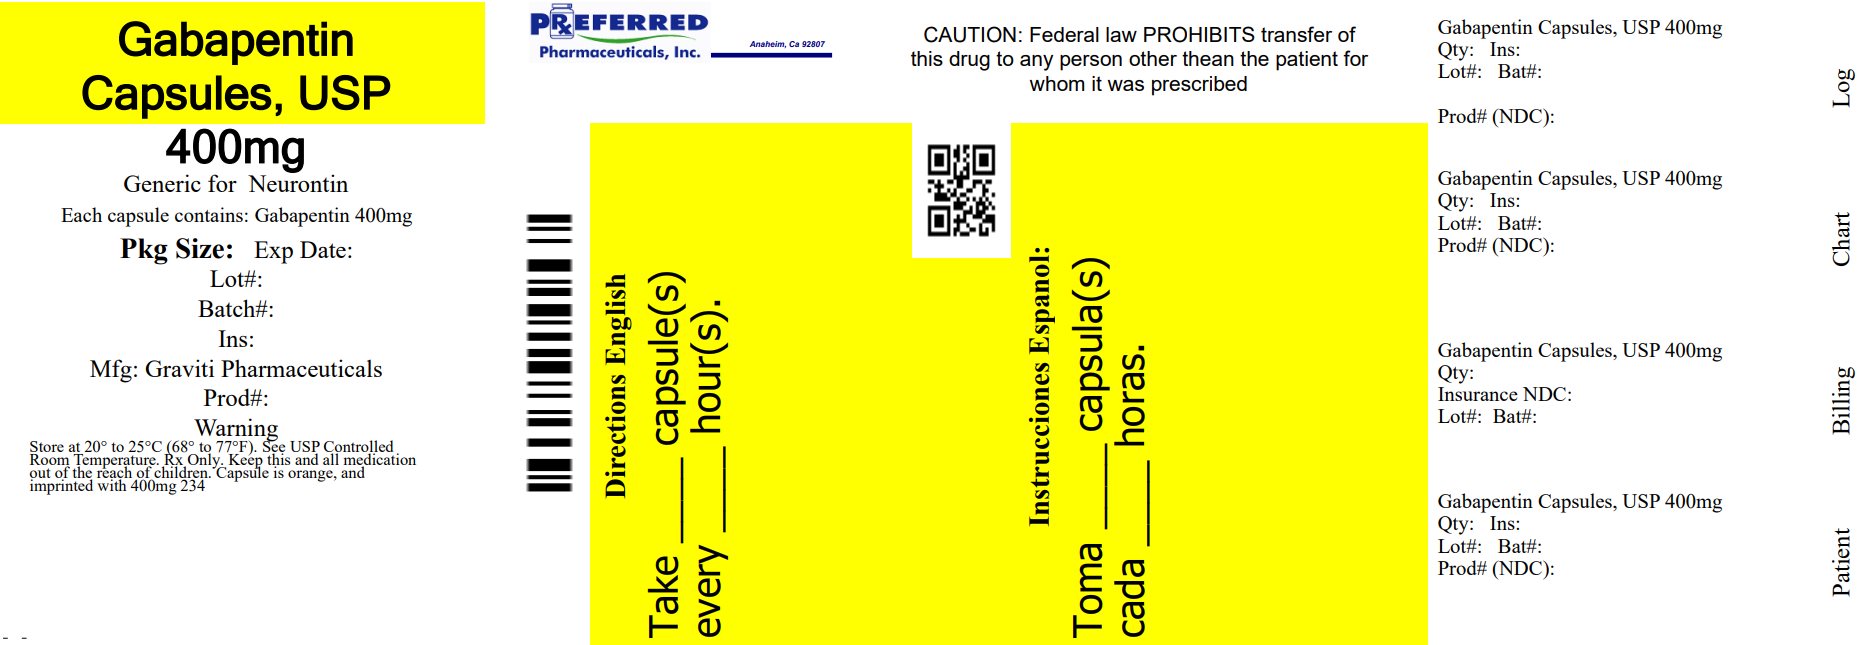
Label for Gabapentin Capsules, USP 400mg by Preferred Pharmaceuticals Inc., generic for Neurontin. The label includes dosage form, strength, manufacturer Graviti Pharmaceuticals, and warnings about storage and prescription. Directions are provided in English and Spanish with blanks for dose and frequency. The label shows barcodes and areas for lot, batch, and expiration details.*

* About these descriptions: Image descriptions on this page are generated by automated AI analysis of the product label images from the manufacturer's FDA label submission (SPL). They are provided for reference only and may contain errors or omissions. Always rely on the printed label itself and the official FDA labeling, and consult a pharmacist or healthcare professional with any questions about this product.