Tizanidine Hydrochloride Capsule
Product Images NDC 68788-8478

View Photos of Packaging, Regulatory Labels, and Product Appearance

Product Visual Gallery

This gallery contains 5 technical images submitted to the FDA as part of the official labeling for Tizanidine Hydrochloride (NDC 68788-8478). Unlike standard consumer photos, these assets often include clinical data figures, molecular chemical structures, and official manufacturer packaging layouts.

As provided by Preferred Pharmaceuticals Inc., these visuals offer a comprehensive scientific overview of the product's physical and chemical identity, aiding pharmacists and researchers in product verification and study.

FDA Label Image

Tizanidine Structure (49d0fb0e 9403 4e99 Bf59 01b9a45a7dde 01)
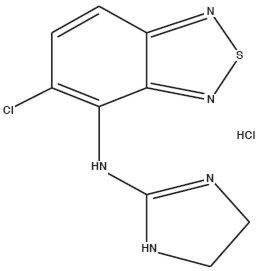
Tizanidine Structure (49d0fb0e 9403 4e99 Bf59 01b9a45a7dde 01)
Chemical structure of tizanidine hydrochloride illustrating the arrangement of atoms and bonds including a chlorinated benzene ring fused to an imidazoline and thiazole ring system as part of the molecule.*
FDA Label Image

Figure 1 (49d0fb0e 9403 4e99 Bf59 01b9a45a7dde 02)

Figure 1 (49d0fb0e 9403 4e99 Bf59 01b9a45a7dde 02)
A pharmacokinetic graph showing plasma tizanidine concentration (ng/mL) over time (hours from dosing) for different administration conditions: 2 x 4 mg tizanidine tablets and capsules, with and without food. The chart compares how food intake affects drug concentration levels over 24 hours.*
FDA Label Image

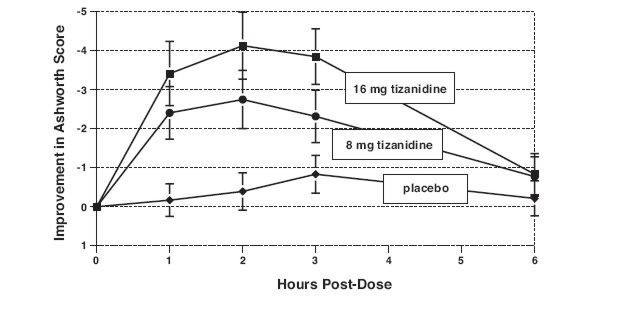
Figure 2 (49d0fb0e 9403 4e99 Bf59 01b9a45a7dde 03)

Figure 2 (49d0fb0e 9403 4e99 Bf59 01b9a45a7dde 03)
Line graph showing improvement in Ashworth Score over 6 hours post-dose for 16 mg and 8 mg tizanidine compared to placebo. The vertical axis represents improvement in Ashworth Score, and the horizontal axis shows time in hours after dosing. Error bars indicate variability at each time point for all groups.*
FDA Label Image

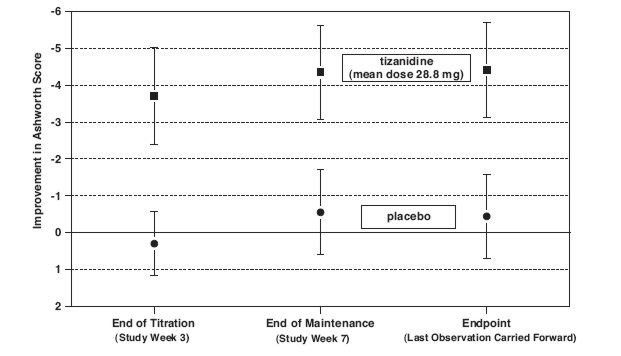
Figure 3 (49d0fb0e 9403 4e99 Bf59 01b9a45a7dde 04)

Figure 3 (49d0fb0e 9403 4e99 Bf59 01b9a45a7dde 04)
A line chart comparing improvement in Ashworth Score over time between tizanidine (mean dose 28.8 mg) and placebo groups. The y-axis shows improvement scores from -6 to 2, and the x-axis shows study timeline points: End of Titration (Week 3), End of Maintenance (Week 7), and Endpoint (Last Observation Carried Forward). Tizanidine shows greater improvement with lower scores compared to placebo at all points.*
FDA Label Image

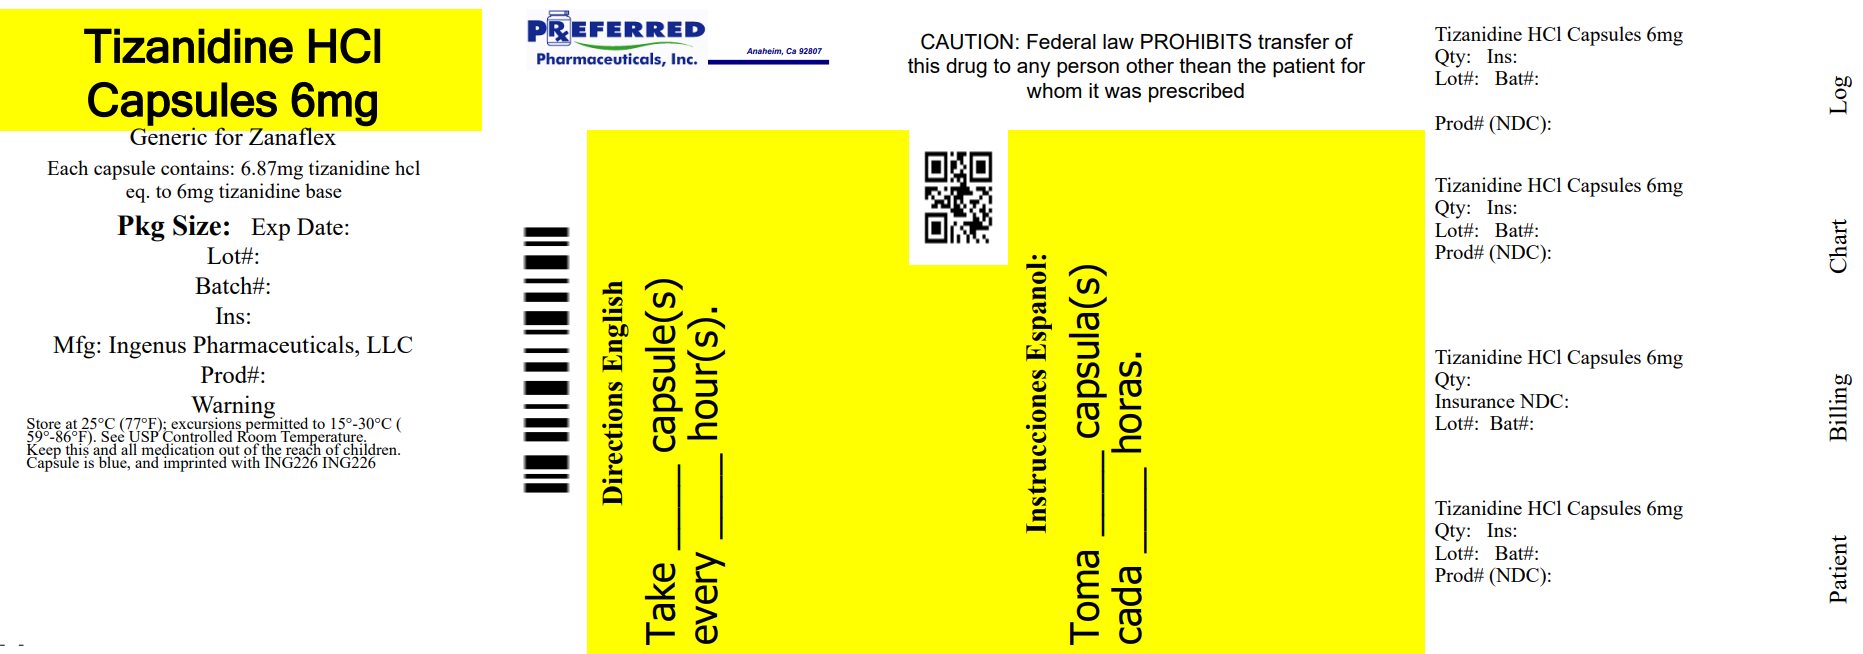
Tizanidine HCl Capsules 6mg (Ae9b6808 632f 4204 8581 Bf146dcab69f 00)

Tizanidine HCl Capsules 6mg (Ae9b6808 632f 4204 8581 Bf146dcab69f 00)
Label for Tizanidine HCl Capsules 6mg by Preferred Pharmaceuticals Inc., featuring dosage information and storage instructions. The label includes cautions and medication directions in both English and Spanish, along with space for batch, lot, and insurance details. The capsule is described as blue with specific imprinting.*

* About these descriptions: Image descriptions on this page are generated by automated AI analysis of the product label images from the manufacturer's FDA label submission (SPL). They are provided for reference only and may contain errors or omissions. Always rely on the printed label itself and the official FDA labeling, and consult a pharmacist or healthcare professional with any questions about this product.