Gabapentin
Product Images NDC 68788-9509

View Photos of Packaging, Regulatory Labels, and Product Appearance

Product Visual Gallery

This gallery contains 6 technical images submitted to the FDA as part of the official labeling for Gabapentin (NDC 68788-9509). Unlike standard consumer photos, these assets often include clinical data figures, molecular chemical structures, and official manufacturer packaging layouts.

As provided by Preferred Pharmaceuticals, Inc., these visuals offer a comprehensive scientific overview of the product's physical and chemical identity, aiding pharmacists and researchers in product verification and study.

FDA Label Image

Gabapentin Capsules, Usp 400mg

Gabapentin Capsules, Usp 400mg
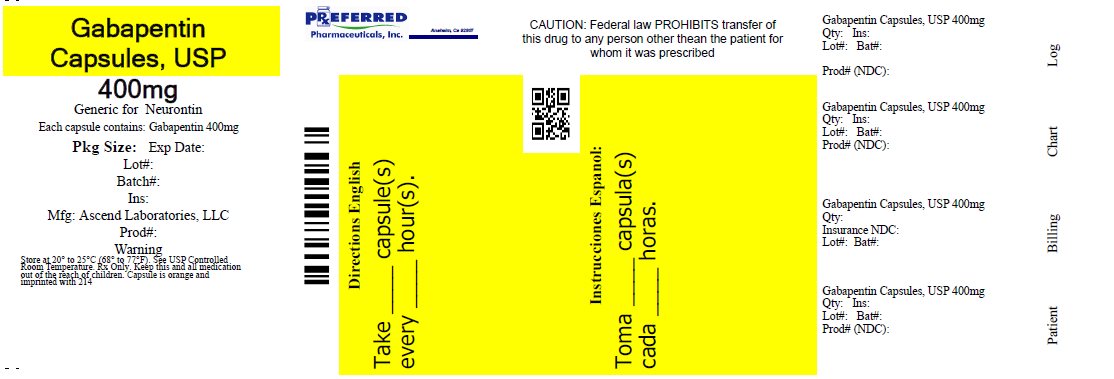
This text contains information about Gabapentin Capsules, USP 400mg, which is a medication used to treat seizures and nerve pain. The text also notes that the transfer of Gabapentin Capsules is prohibited by federal law without a prescription. The product is a generic version of Neurontin and is manufactured by Ascend Laboratories, LLC. Additionally, the text provides information about the capsule contents and packaging details.*
FDA Label Image

Gabapentin-equation (Gabapentin Equation)

Gabapentin-equation (Gabapentin Equation)
This appears to be a formula for calculating something related to medical information, possibly related to kidney function. The formula includes weight in kilograms, serum creatinine levels measured in mg/dL, and a multiplier specific to female patients. However, the quality of the text is poor and it is difficult to interpret certain characters, so the formula may not be accurate or complete.*
FDA Label Image

Gabapentin Fig1

Gabapentin Fig1
This is a chart showing the mean pain score for a 4-week dose titration period and a 4-week fixed dose period. The baseline score is not available. The chart compares the effects of a placebo with Gabapentin at a dosage of 3600mg/day.*
FDA Label Image

Gabapentin Fig2

Gabapentin Fig2
This appears to be a chart or graph showing mean pain score data over different periods for a study involving a placebo and different doses of gabapentin. The chart includes baseline data and different weeks of the study.*
FDA Label Image

Gabapentin Fig3

Gabapentin Fig3
The text is a table showing the percentage of responders at endpoint in controlled PHN studies. It includes the percentage of patients who had a 50% reduction in pain score and the different treatments used in the studies (GBP 3600, PBO, GEBP 1800, and GBP 2400). There is also a note indicating that "#p<00l< 0,001" (presumably indicating a statistically significant difference between groups) but no further details are available.*
FDA Label Image

Gabapentin-fig4 (Gabapentin Fig4)

* These product label images have been analyzed using experimental machine learning. Please verify findings with the primary label text.