Memantine Hydrochloride Solution
Product Images NDC 68999-943

View Photos of Packaging, Regulatory Labels, and Product Appearance

Product Visual Gallery

This gallery contains 10 technical images submitted to the FDA as part of the official labeling for Memantine Hydrochloride (NDC 68999-943). Unlike standard consumer photos, these assets often include clinical data figures, molecular chemical structures, and official manufacturer packaging layouts.

As provided by Chartwell Governmental & Specialty Rx, Llc., these visuals offer a comprehensive scientific overview of the product's physical and chemical identity, aiding pharmacists and researchers in product verification and study.

FDA Label Image

"image Description" (Memantine Hydro Cup Label)
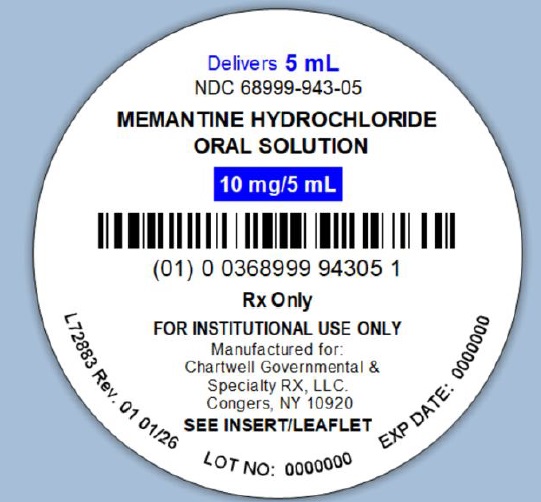
"image Description" (Memantine Hydro Cup Label)
Circular packaging label for Memantine Hydrochloride oral solution, 10 mg/5 mL strength. The label indicates a 5 mL delivery volume and includes a barcode, Rx only designation, and states it is for institutional use only. Manufactured for Chartwell Governmental & Specialty RX, LLC in Congers, NY.*
FDA Label Image

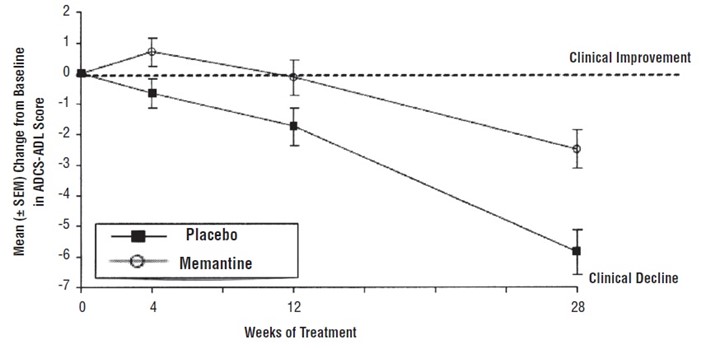
"image Description" (Memantine Hydro Fig 1)

"image Description" (Memantine Hydro Fig 1)
A line graph depicting the mean change from baseline in ADCS-ADL score over 28 weeks of treatment for two groups: Placebo and Memantine. The Y-axis measures the mean change in score, ranging from clinical improvement at the top to clinical decline at the bottom. The X-axis shows weeks of treatment (0, 4, 12, and 28). The Memantine group shows less decline in scores over time compared to the Placebo group, which shows a greater decline, indicating a comparative analysis of treatment effects.*
FDA Label Image

"image Description" (Memantine Hydro Fig 2)

"image Description" (Memantine Hydro Fig 2)
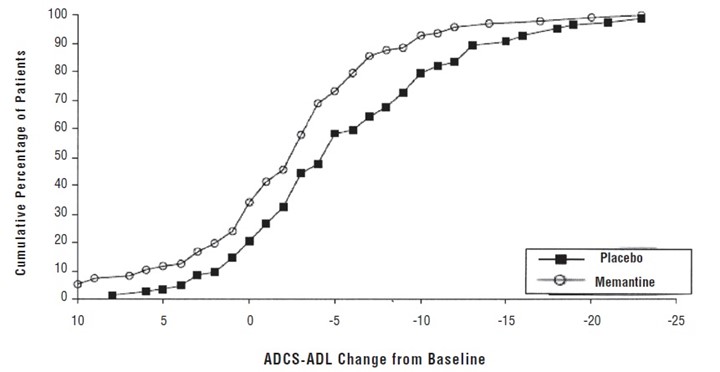
A cumulative percentage plot showing patient response comparing Memantine and placebo groups. The x-axis represents ADCS-ADL change from baseline, ranging from 10 to -25, while the y-axis shows the cumulative percentage of patients from 0% to 100%. Memantine is represented by circles and placebo by squares, indicating differences in the distribution of ADCS-ADL change between treatments.*
FDA Label Image

"image Description" (Memantine Hydro Fig 3)

"image Description" (Memantine Hydro Fig 3)
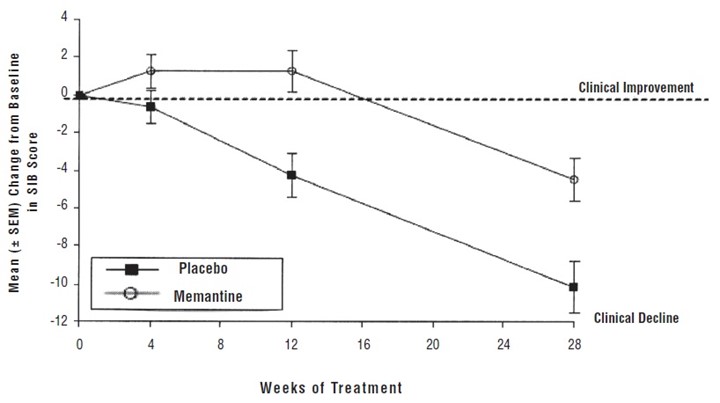
A line graph showing mean change from baseline in SIB score over 28 weeks of treatment comparing placebo and memantine. The x-axis represents weeks of treatment, and the y-axis shows mean change with clinical improvement above and clinical decline below the baseline. Memantine data points remain near baseline with a slight improvement, while placebo shows a decline over time.*
FDA Label Image

"image Description" (Memantine Hydro Fig 4)

"image Description" (Memantine Hydro Fig 4)
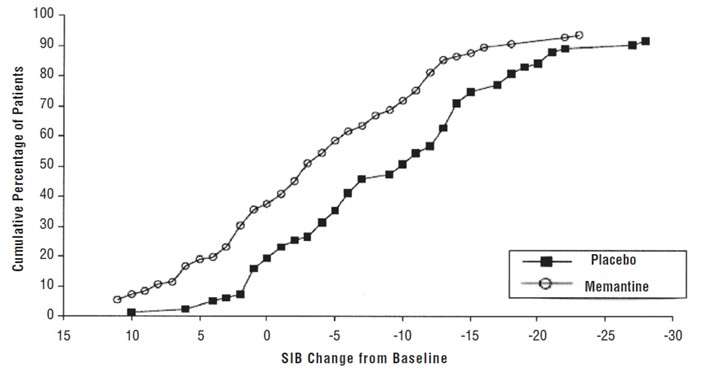
A cumulative percentage of patients chart depicting SIB change from baseline, comparing Memantine and Placebo treatments. The x-axis shows SIB change values ranging from 15 to -30, and the y-axis shows cumulative percentage of patients from 0% to 100%. The Memantine line depicts a higher cumulative percentage at greater negative SIB changes compared to Placebo.*
FDA Label Image

"image Description" (Memantine Hydro Fig 5)

"image Description" (Memantine Hydro Fig 5)
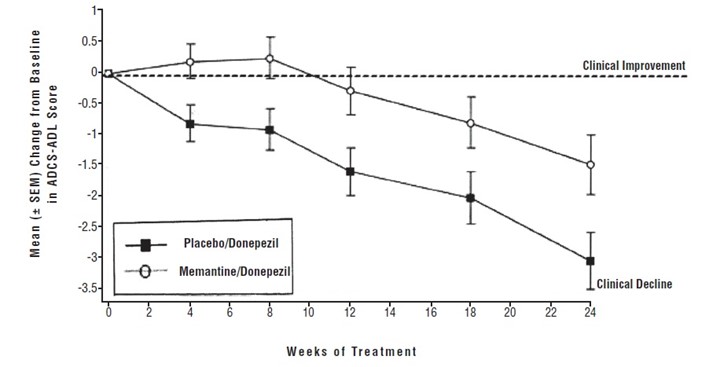
A line graph depicting mean change from baseline in ADCS-ADL score over 24 weeks of treatment. Two groups are compared: Placebo/Donepezil and Memantine/Donepezil. The graph shows trends in clinical improvement and decline, with error bars indicating standard error of the mean.*
FDA Label Image

"image Description" (Memantine Hydro Fig 6)

"image Description" (Memantine Hydro Fig 6)
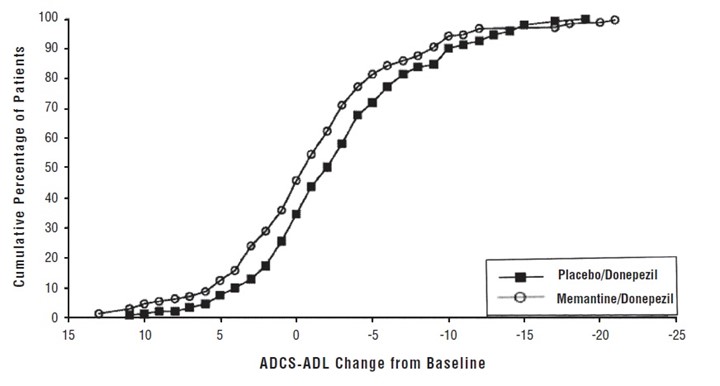
A cumulative percentage curve graph showing patient responses to two treatments: Placebo/Donepezil and Memantine/Donepezil. The x-axis represents ADCS-ADL change from baseline (functional assessment), and the y-axis shows the cumulative percentage of patients from 0 to 100%. The graph compares the effect of the two treatments on patient outcomes over a range of functional changes.*
FDA Label Image

"image Description" (Memantine Hydro Fig 7)

"image Description" (Memantine Hydro Fig 7)
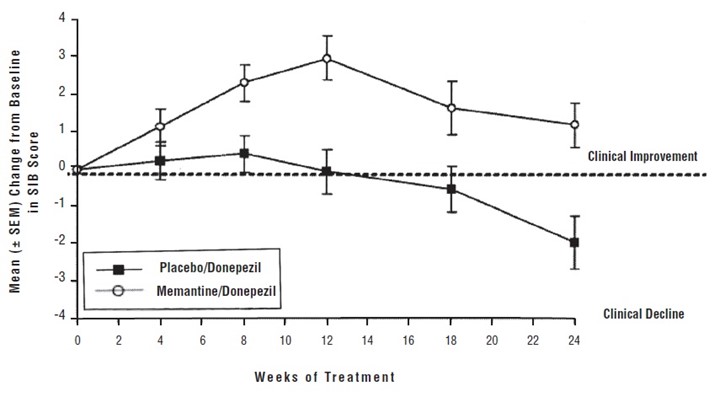
A line graph showing mean change from baseline in SIB (Severe Impairment Battery) score over 24 weeks of treatment. The graph compares two groups: Memantine/Donepezil and Placebo/Donepezil, illustrating clinical improvement and decline trends during the treatment period.*
FDA Label Image

"image Description" (Memantine Hydro Fig 8)

"image Description" (Memantine Hydro Fig 8)
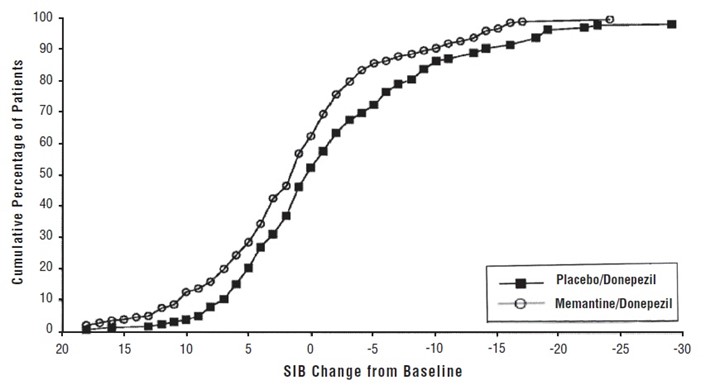
A cumulative percentage graph showing patient response comparing Memantine/Donepezil and Placebo/Donepezil groups. The X-axis represents SIB change from baseline with negative values indicating improvement. The Y-axis shows cumulative percentage of patients. Two curves are plotted: one with open circles for Memantine/Donepezil, and one with filled squares for Placebo/Donepezil, demonstrating differences in patient outcomes over the SIB change range.*
FDA Label Image

"image Description" (Memantine Hydro Structure)

"image Description" (Memantine Hydro Structure)
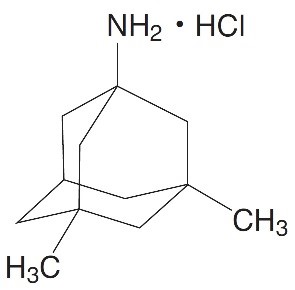
Chemical structure of Memantine Hydrochloride showing the molecular framework with an amine group complexed with hydrochloride (NH2 ยท HCl) and methyl substituents attached to the adamantane cage-like structure.*

* About these descriptions: Image descriptions on this page are generated by automated AI analysis of the product label images from the manufacturer's FDA label submission (SPL). They are provided for reference only and may contain errors or omissions. Always rely on the printed label itself and the official FDA labeling, and consult a pharmacist or healthcare professional with any questions about this product.