Gabapentin Capsule
Product Images NDC 69097-813

19 FDA label images from Cipla Usa Inc. · Packaging, Regulatory Labels, and Product Appearance

Product Visual Gallery

This gallery contains 19 technical images submitted to the FDA as part of the official labeling for Gabapentin (NDC 69097-813). Unlike standard consumer photos, these assets often include clinical data figures, molecular chemical structures, and official manufacturer packaging layouts.

As provided by Cipla Usa Inc., these visuals offer a comprehensive scientific overview of the product's physical and chemical identity, aiding pharmacists and researchers in product verification and study.

FDA Label Image

Image (100caps 100mg Asc)
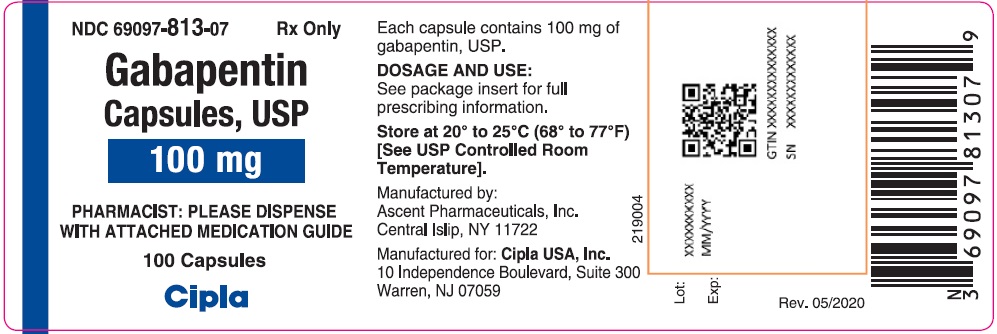
Image (100caps 100mg Asc)
Gabapentin Capsules, USP 100 mg label showing NDC 69097-813-07. The label states the package contains 100 capsules. Manufacturer is Ascent Pharmaceuticals, Inc., made for Cipla USA, Inc. Storage instructions specify 20° to 25°C. The label includes instructions to dispense with the medication guide and a barcode with QR code.*
FDA Label Image

Image (100caps 100mg Inv)

Image (100caps 100mg Inv)
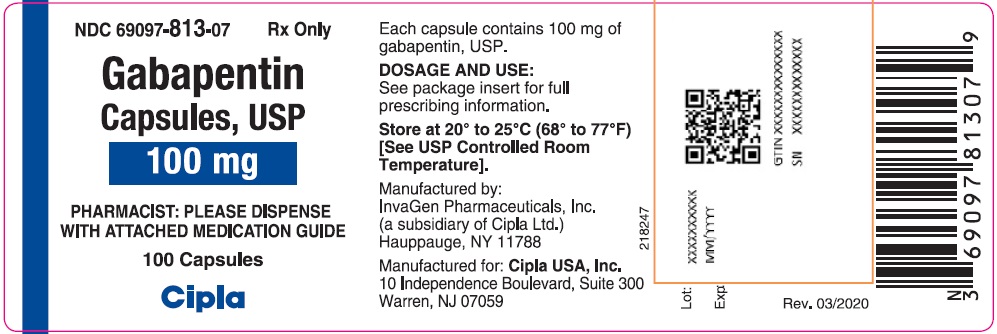
Gabapentin Capsules, USP 100 mg label from Cipla USA Inc., for a bottle containing 100 capsules. The label includes storage instructions to keep at 20° to 25°C and notes the product is manufactured by InvaGen Pharmaceuticals, a Cipla Ltd. subsidiary.*
FDA Label Image

Image (100caps 300mg Asc)

Image (100caps 300mg Asc)
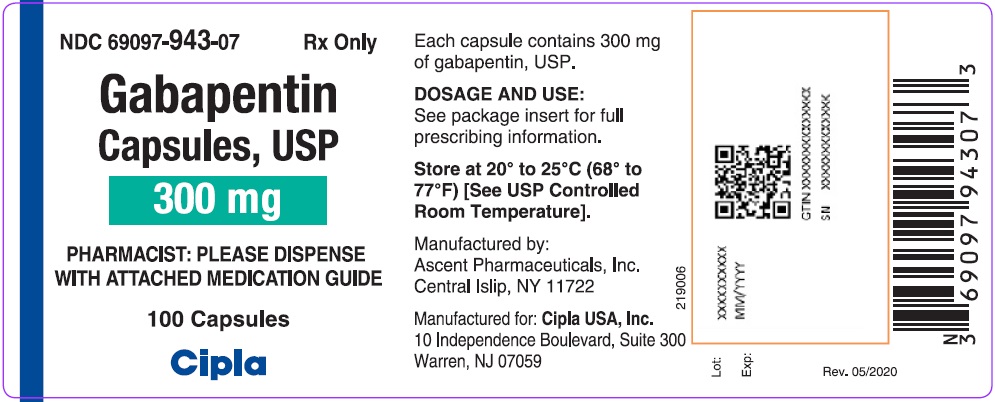
Label for Gabapentin Capsules, USP 300 mg by Cipla USA Inc. The label states each capsule contains 300 mg of gabapentin and includes storage instructions between 20° to 25°C (68° to 77°F). The package contains 100 capsules and directs pharmacists to dispense with an attached medication guide. Manufactured by Ascent Pharmaceuticals, Inc., Central Islip, NY, and distributed by Cipla USA, Inc.*
FDA Label Image

Image (100caps 300mg Inv)

Image (100caps 300mg Inv)
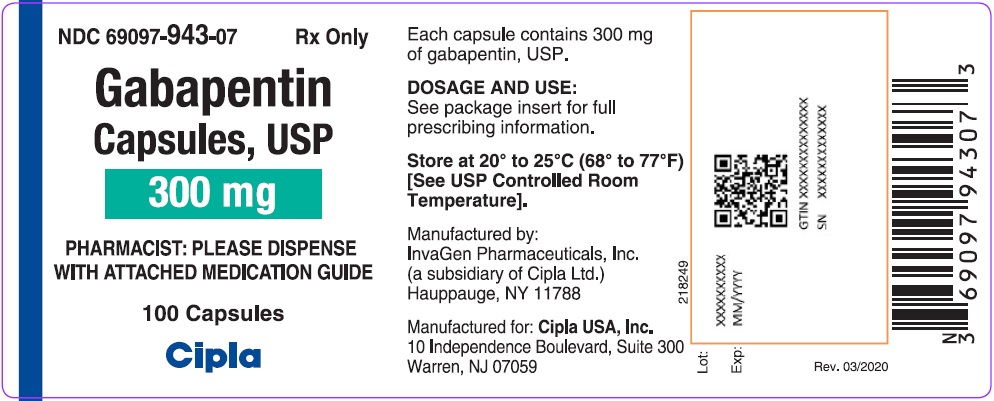
Label for Gabapentin Capsules USP 300 mg, containing 100 capsules, labeled by Cipla USA Inc. The label states the dosage strength as 300 mg per capsule and directs pharmacists to dispense with the attached medication guide. It includes storage instructions and manufacturing details, noting InvaGen Pharmaceuticals, a Cipla subsidiary, as the manufacturer.*
FDA Label Image

Image (100caps 300mg Oldace)

Image (100caps 300mg Oldace)
Gabapentin Capsules, USP 300 mg label from Cipla USA Inc. The label includes the NDC number 69097-814-07, instructions to dispense with an attached medication guide, and states the package contains 100 capsules. It lists storage conditions of 20° to 25°C (68° to 77°F), manufacturer details, and dosage information to refer to the package insert. The label also features a barcode and QR code.*
FDA Label Image

Image (100caps 300mg Oldinv)

Image (100caps 300mg Oldinv)
Label for Gabapentin Capsules, USP 300 mg manufactured by Cipla USA Inc. The label includes the NDC 69097-814-07, states the quantity of 100 capsules, dosage information, storage instructions (20° to 25°C), and notes the manufacturer as InvaGen Pharmaceuticals, Inc., a subsidiary of Cipla Ltd.*
FDA Label Image

Image (100caps 400mg Asc)

Image (100caps 400mg Asc)
Gabapentin Capsules USP 400 mg label showing 100 capsules in the package. The label includes directions to dispense with a medication guide and provides storage instructions at 20° to 25°C. It is manufactured by Ascent Pharmaceuticals, Inc. and labeled for Cipla USA Inc.*
FDA Label Image

Image (100caps 400mg Inv)

Image (100caps 400mg Inv)
Gabapentin Capsules, USP 400 mg label showing a carton panel with the Cipla logo. The label states 100 capsules per package with directions to dispense with the medication guide. It includes storage instructions at 20 to 25°C and manufacturing details for InvaGen Pharmaceuticals and Cipla USA, Inc. The label displays a barcode, QR code, and NDC number 69097-815-07.*
FDA Label Image

Image (D3fd11fe 4d3f 4002 8f9e 42cc12b4252d 01)

Image (D3fd11fe 4d3f 4002 8f9e 42cc12b4252d 01)
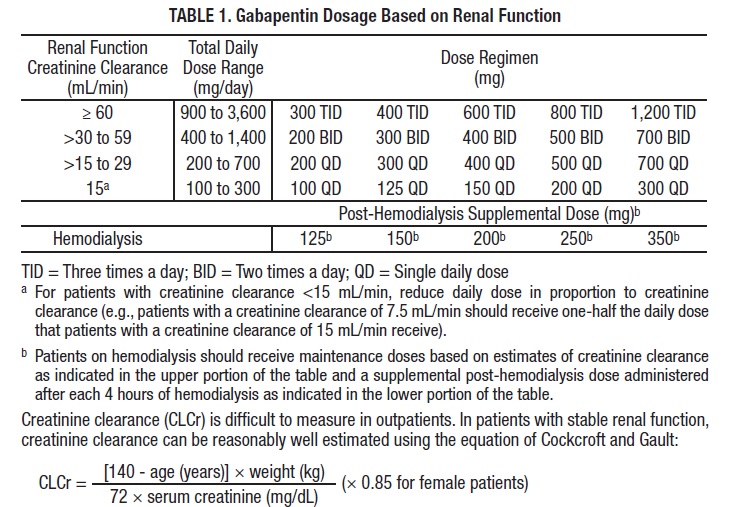
A data table titled 'Gabapentin Dosage Based on Renal Function' showing dosage regimens of gabapentin in mg for various ranges of creatinine clearance (mL/min). The table includes total daily dose ranges and dose regimens for different frequencies (TID, BID, QD). It also provides supplemental doses for post-hemodialysis, abbreviations for dosing frequency, notes on dose adjustments for patients with low creatinine clearance, and the Cockcroft and Gault equation for estimating creatinine clearance.*
FDA Label Image

Image (D3fd11fe 4d3f 4002 8f9e 42cc12b4252d 03)

Image (D3fd11fe 4d3f 4002 8f9e 42cc12b4252d 03)
Data table titled 'Risk by Indication for Antiepileptic Drugs in the Pooled Analysis' showing risk metrics for epilepsy, psychiatric, and other indications. It presents events per 1,000 patients for placebo and drug groups, relative risk ratios comparing drug to placebo, and risk differences indicating additional drug patient events per 1,000 patients.*
FDA Label Image

Image (D3fd11fe 4d3f 4002 8f9e 42cc12b4252d 04)

Image (D3fd11fe 4d3f 4002 8f9e 42cc12b4252d 04)
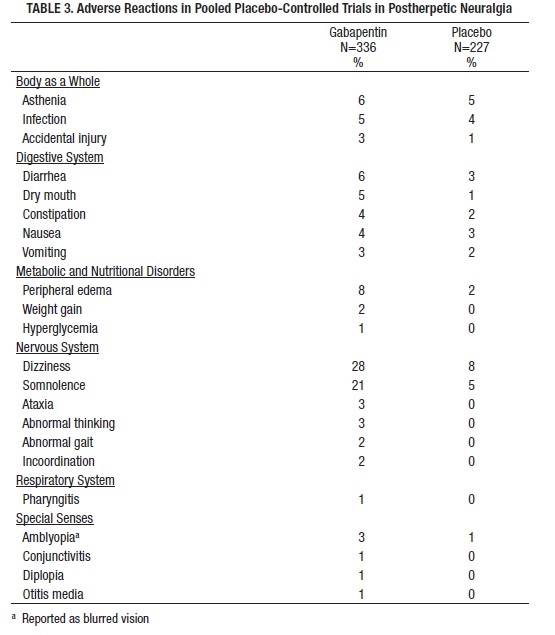
A data table titled 'TABLE 3. Adverse Reactions in Pooled Placebo-Controlled Trials in Postherpetic Neuralgia' comparing the percentage of adverse reactions in patients treated with Gabapentin (N=336) versus placebo (N=227). It categorizes adverse reactions by body system, including Body as a Whole, Digestive System, Metabolic and Nutritional Disorders, Nervous System, Respiratory System, and Special Senses, listing specific symptoms and their respective occurrence percentages.*
FDA Label Image

Image (D3fd11fe 4d3f 4002 8f9e 42cc12b4252d 05)

Image (D3fd11fe 4d3f 4002 8f9e 42cc12b4252d 05)
A data table titled 'Adverse Reactions in Pooled Placebo-Controlled Add-On Trials In Epilepsy Patients >12 years of age' comparing the percentage incidence of adverse reactions between Gabapentin (N=543) and Placebo (N=378). It lists adverse reactions by body system (e.g., nervous, digestive, cardiovascular) with corresponding percentages for each treatment group, including symptoms like somnolence, dizziness, fatigue, and diplopia.*
FDA Label Image

Image (D3fd11fe 4d3f 4002 8f9e 42cc12b4252d 06)

Image (D3fd11fe 4d3f 4002 8f9e 42cc12b4252d 06)
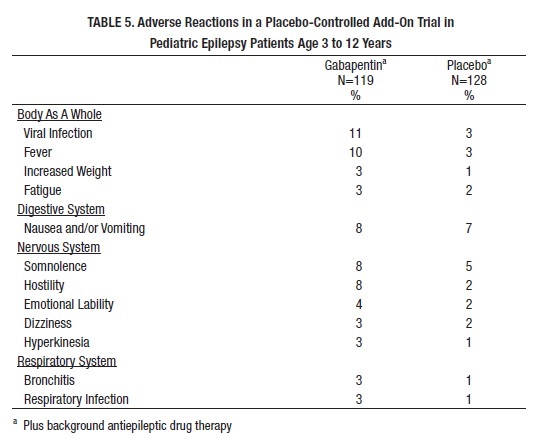
A data table titled 'TABLE 5. Adverse Reactions in a Placebo-Controlled Add-On Trial in Pediatric Epilepsy Patients Age 3 to 12 Years.' It compares the percentage of various adverse reactions between Gabapentin (N=119) and Placebo (N=128) groups, organized by body systems such as Body As A Whole, Digestive System, Nervous System, and Respiratory System. Specific reactions and their incidence percentages are listed for each group.*
FDA Label Image

Image (D3fd11fe 4d3f 4002 8f9e 42cc12b4252d 07)

Image (D3fd11fe 4d3f 4002 8f9e 42cc12b4252d 07)
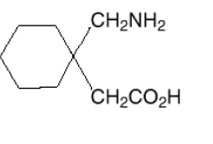
Chemical structure diagram of the active ingredient Gabapentin showing a cyclohexane ring bonded to an amino group (CH2NH2) and an acetic acid moiety (CH2CO2H). This structural formula represents the molecular arrangement of Gabapentin.*
FDA Label Image

Image (D3fd11fe 4d3f 4002 8f9e 42cc12b4252d 08)

Image (D3fd11fe 4d3f 4002 8f9e 42cc12b4252d 08)
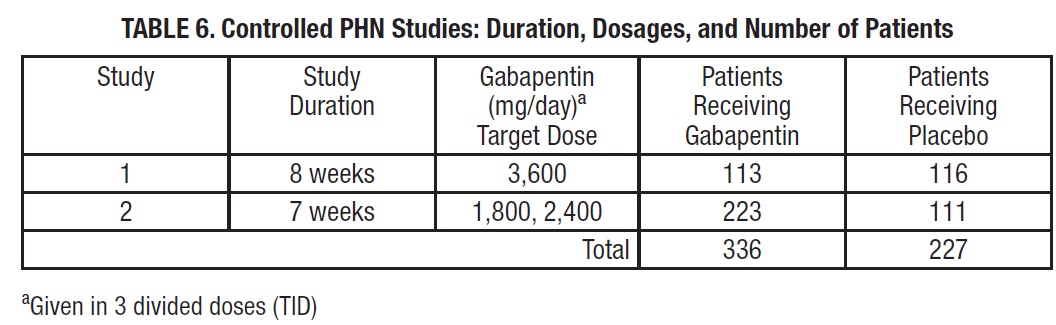
Table titled 'Controlled PHN Studies: Duration, Dosages, and Number of Patients' summarizing two studies. It details study duration (7-8 weeks), gabapentin target doses (1,800 to 3,600 mg/day given in 3 divided doses), and the number of patients receiving gabapentin or placebo.*
FDA Label Image

Image (D3fd11fe 4d3f 4002 8f9e 42cc12b4252d 09)

Image (D3fd11fe 4d3f 4002 8f9e 42cc12b4252d 09)
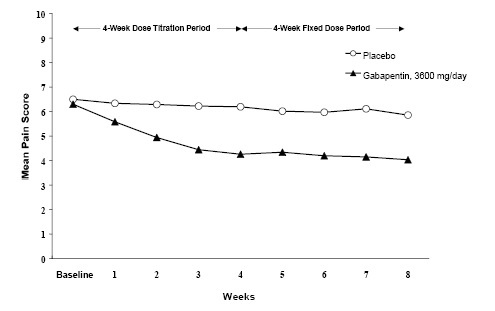
A line graph comparing mean pain score over 8 weeks between placebo and Gabapentin 3600 mg/day groups. The x-axis shows weeks with separate 4-week dose titration and 4-week fixed dose periods. The y-axis indicates mean pain score from 0 to 10. Gabapentin group shows a decrease in pain score over time, while placebo remains relatively stable.*
FDA Label Image

Image (D3fd11fe 4d3f 4002 8f9e 42cc12b4252d 10)

Image (D3fd11fe 4d3f 4002 8f9e 42cc12b4252d 10)
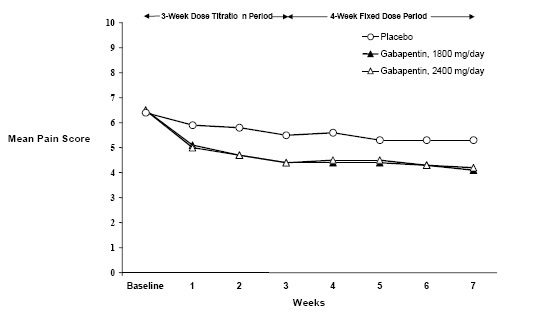
A line graph showing mean pain scores over seven weeks comparing placebo, Gabapentin 1800 mg/day, and Gabapentin 2400 mg/day. The graph indicates a 3-week dose titration period followed by a 4-week fixed dose period, with pain scores generally decreasing more for Gabapentin groups than placebo over time.*
FDA Label Image

Image (D3fd11fe 4d3f 4002 8f9e 42cc12b4252d 11)

Image (D3fd11fe 4d3f 4002 8f9e 42cc12b4252d 11)
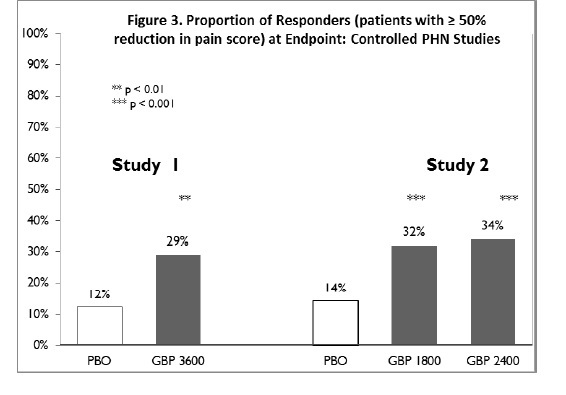
A bar chart titled 'Figure 3. Proportion of Responders (patients with ≥ 50% reduction in pain score) at Endpoint: Controlled PHN Studies' comparing placebo (PBO) and gabapentin (GBP) at different dosages across two studies. It shows percentages of responders, with bars for Study 1 (PBO 12%, GBP 3600 29%) and Study 2 (PBO 14%, GBP 1800 32%, GBP 2400 34%). Statistical significance is noted with p-values less than 0.01 and 0.001.*
FDA Label Image

Image (D3fd11fe 4d3f 4002 8f9e 42cc12b4252d 12)

Image (D3fd11fe 4d3f 4002 8f9e 42cc12b4252d 12)
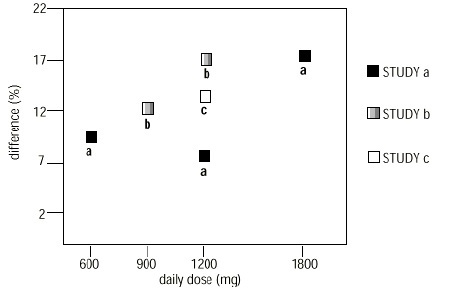
A scatter plot comparing the percentage difference by daily dose (mg) for three studies labeled as STUDY a, STUDY b, and STUDY c. The x-axis shows daily doses of 600, 900, 1200, and 1800 mg, and the y-axis shows difference percentages ranging from 2% to 22%. Each study's data points are marked with distinct square symbols.*

* About these descriptions: Image descriptions on this page are generated by automated AI analysis of the product label images from the manufacturer's FDA label submission (SPL). They are provided for reference only and may contain errors or omissions. Always rely on the printed label itself and the official FDA labeling, and consult a pharmacist or healthcare professional with any questions about this product.