Anastrozole Tablet
Product Images NDC 69117-0003

View Photos of Packaging, Regulatory Labels, and Product Appearance

Product Visual Gallery

This gallery contains 10 technical images submitted to the FDA as part of the official labeling for Anastrozole (NDC 69117-0003). Unlike standard consumer photos, these assets often include clinical data figures, molecular chemical structures, and official manufacturer packaging layouts.

As provided by Yiling Pharmaceutical, Inc., these visuals offer a comprehensive scientific overview of the product's physical and chemical identity, aiding pharmacists and researchers in product verification and study.

FDA Label Image

1000 Tablets (1000)

1000 Tablets (1000)
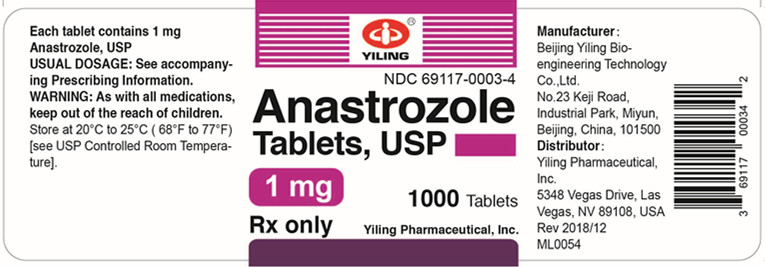
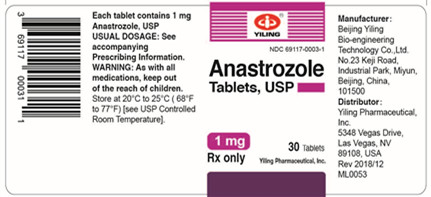
Each tablet contains 1mg Anastrozole. This medication's usual dosage and prescribing information should be consulted before use. It is important to keep this medication out of reach of children and store it at a controlled room temperature of 20°C to 25°C (68°F to 77°F). The manufacturer is Beijng Yiling Bio-engineering Technology Co. Ltd., located at No.23 Keji Road, Industril Park, Miyun, Beijng, China, 101500. The distributor is Yiing Pharmaceutica, Inc., located at 5348 Vegas Drive, Las Vegas, NV 89108, USA. The NDC code for this medication is 69117-0003-4.*
FDA Label Image

30 Tablets (30)

FDA Label Image

7b4ba0c5 0287 B7a7 E053 2991aa0a575e

FDA Label Image

Chemical Structure For Anastrozole (Image 01)

FDA Label Image

Figure 1 (Image 02)

Figure 1 (Image 02)
This text shows the results of a randomized treatment study involving anastrozole and tamoxifen drugs. The proportion of patients who were alive and disease-free was measured over a period of 90 months. The number of patients at risk for both drugs was also recorded for each month.*
FDA Label Image

Figure 2 (Image 03)

Figure 2 (Image 03)
This is a graph showing the proportion of patients who were alive and disease-free after randomized treatment with either anastrozole or tamoxifen. The x-axis represents the time in months and the y-axis represents the proportion of patients. The graph shows disease-free survival for each treatment over 90 months, with the number of patients at risk listed for each time point.*
FDA Label Image

Figure 3 (Image 04)

FDA Label Image

Figure 4 (Image 05)

Figure 4 (Image 05)
This appears to be a truncated Kaplan-Meier survival curve for two treatments, Anastozole and Tavoxifen, for a medical condition. The graph shows the proportion of patients who have not experienced an event (such as death or complications) over a period of months. The text provides the number of patients at risk for each month of the study. The vertical axis has been truncated for clarity.*
FDA Label Image

Figure 5 (Image 06)

FDA Label Image

Figure 6 (Image 07)

* These product label images have been analyzed using experimental machine learning. Please verify findings with the primary label text.