Toviaz
Product Images NDC 69189-0244

View Photos of Packaging, Regulatory Labels, and Product Appearance

Product Visual Gallery

This gallery contains 7 technical images submitted to the FDA as part of the official labeling for Toviaz (NDC 69189-0244). Unlike standard consumer photos, these assets often include clinical data figures, molecular chemical structures, and official manufacturer packaging layouts.

As provided by Avera Mckennan Hospital, these visuals offer a comprehensive scientific overview of the product's physical and chemical identity, aiding pharmacists and researchers in product verification and study.

FDA Label Image

Fesoterodine Er 8 mg Tablet (6918902441)

Fesoterodine Er 8 mg Tablet (6918902441)
Label for Toviaz 8 mg tablet containing fesoterodine fumarate ER. The label indicates manufacturing by Pfizer with lot numbers and an expiration date of 12/14/2016. The labeler is Avera McKennan Hospital, Sioux Falls, SD, and the NDC is 69189-02441.*
FDA Label Image

Chemical Structure (Toviaz 01)

Chemical Structure (Toviaz 01)
Chemical structure of the active ingredient for Toviaz, as registered by Avera McKennan Hospital under NDC 69189-0244. The image shows the molecular formula including rings, functional groups, and side chains typical for the compound.*
FDA Label Image

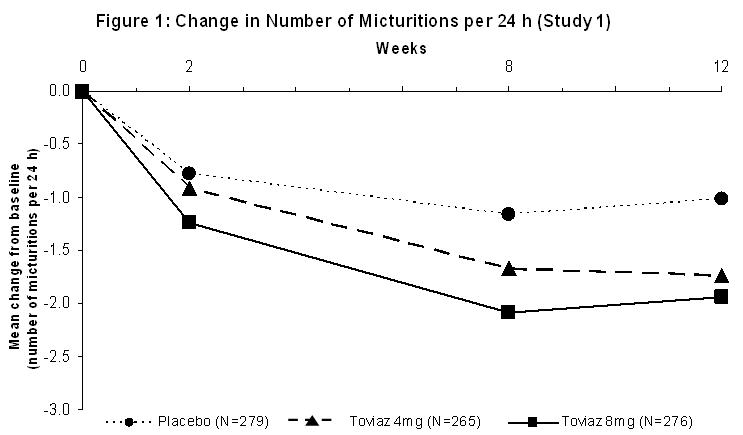
Figure 1 (Toviaz 02)

Figure 1 (Toviaz 02)
A line graph titled 'Change in Number of Micturitions per 24 h (Study 1)' depicting the mean change from baseline in number of micturitions per 24 hours over a 12-week period. The x-axis represents weeks (0 to 12) and the y-axis represents the mean change from baseline ranging from 0.0 to -3.0. Three lines are shown: Placebo, Toviaz 4 mg, and Toviaz 8 mg, each with distinct markers and line styles. Both Toviaz 4 mg and 8 mg show a greater reduction in mean number of micturitions compared to placebo over time.*
FDA Label Image

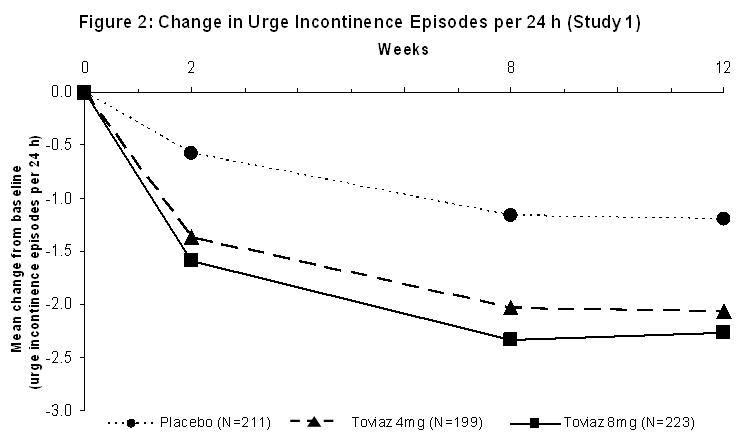
Figure 2 (Toviaz 03)

Figure 2 (Toviaz 03)
Line graph depicting change in urge incontinence episodes per 24 hours over 12 weeks among three groups: Placebo, Toviaz 4 mg, and Toviaz 8 mg. The vertical axis shows mean change from baseline episodes, and the horizontal axis is time in weeks. Toviaz groups show greater decreases compared to placebo.*
FDA Label Image

Figure 3 (Toviaz 04)

Figure 3 (Toviaz 04)
Line graph titled 'Change in Number of Micturitions per 24 h (Study 2)' showing mean change from baseline in number of micturitions over 12 weeks. The x-axis represents weeks (0 to 12) and the y-axis shows mean change from baseline (0 to -3). Three lines represent Placebo (N=266), Toviaz 4 mg (N=267), and Toviaz 8 mg (N=267), illustrating greater reduction in micturitions for Toviaz groups compared to placebo over time.*
FDA Label Image

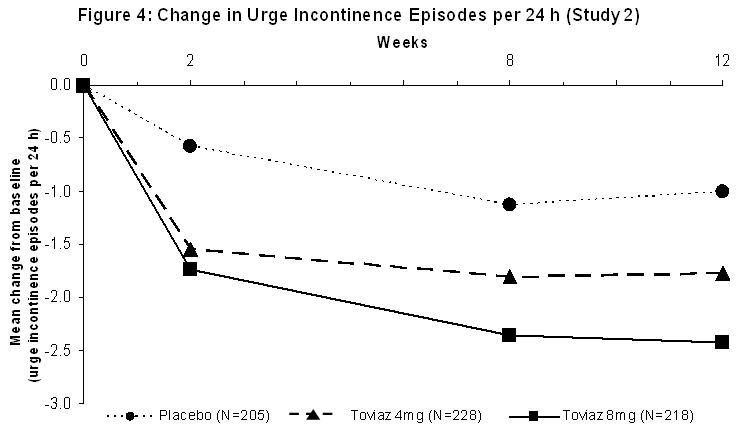
Figure 4 (Toviaz 05)

Figure 4 (Toviaz 05)
A line graph depicting changes in urge incontinence episodes per 24 hours over 12 weeks from baseline. It compares placebo, Toviaz 4 mg, and Toviaz 8 mg, showing mean reductions over time, with Toviaz 8 mg demonstrating the greatest decrease in episodes.*
FDA Label Image

Logo (Toviaz 06)

* About these descriptions: Image descriptions on this page are generated by automated AI analysis of the product label images from the manufacturer's FDA label submission (SPL). They are provided for reference only and may contain errors or omissions. Always rely on the printed label itself and the official FDA labeling, and consult a pharmacist or healthcare professional with any questions about this product.