Xifaxan
Product Images NDC 69189-0309

View Photos of Packaging, Regulatory Labels, and Product Appearance

Product Visual Gallery

This gallery contains 5 technical images submitted to the FDA as part of the official labeling for Xifaxan (NDC 69189-0309). Unlike standard consumer photos, these assets often include clinical data figures, molecular chemical structures, and official manufacturer packaging layouts.

As provided by Avera Mckennan Hospital, these visuals offer a comprehensive scientific overview of the product's physical and chemical identity, aiding pharmacists and researchers in product verification and study.

FDA Label Image

Rifaximin 200 mg Tablet (6918903091)

Rifaximin 200 mg Tablet (6918903091)
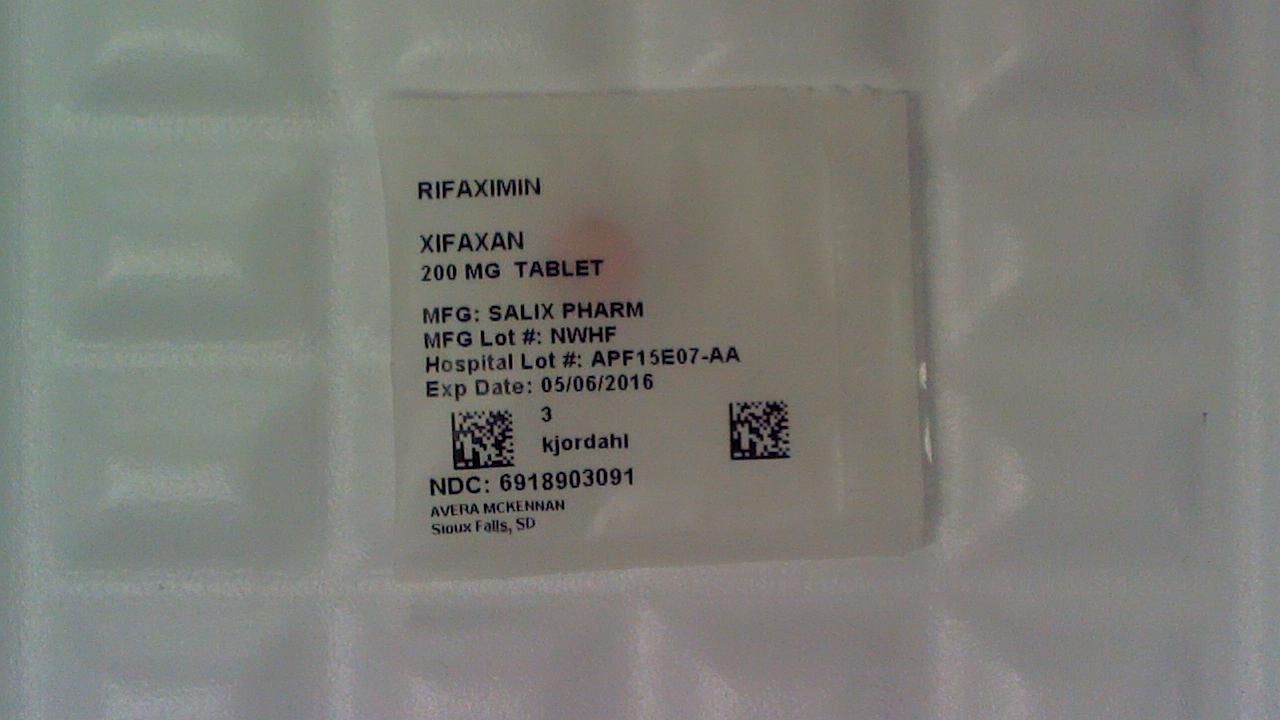
This is a description of a medication called Rifaximin, also known as Xifaxan. It comes in the form of a 200mg tablet manufactured by Salix Pharm with the lot number NWHF. The medication has been assigned a hospital lot number of APF15E07-AA and has an expiration date of 05/06/2016. The National Drug Code (NDC) for this medication is 6918903091. The medication is associated with the Avera McKennan hospital in Sioux Falls, South Dakota.*
FDA Label Image

Figure 3 (Figure3)

Figure 3 (Figure3)
This appears to be a description of a study design for a trial involving different treatments and phases. The design includes screening, treatment phases, maintenance phases, and follow-up phases. There is also mention of obtaining a daily/weekly symptom diary. Further information is not available.*
FDA Label Image

Chemical Structure (Image 01)

FDA Label Image

Figure 1 (Image 02)

Figure 1 (Image 02)
This appears to be a graph or chart displaying data related to a study or clinical trial involving a medication called XIFAXAN. The graph shows the proportion of patients without breakthrough HE over time (measured in days post-randomization), with a hazard ratio of 0.421 and a 95% confidence interval. Additional information may be available in the original source material.*
FDA Label Image

Figure 2 (Image 03)

Figure 2 (Image 03)
The text describes a graph showing the proportion of patients who did not require hospitalization related to hepatic encephalopathy (HE) over time. The graph shows data for two groups, one of which was given a placebo. The hazard ratio and confidence interval are also provided, along with a p-value. The graph covers a period of time from day 0 (post-randomization) to an unclear endpoint.*

* These product label images have been analyzed using experimental machine learning. Please verify findings with the primary label text.