Quetiapine Fumarate
Product Images NDC 69189-0495

4 FDA label images from Avera Mckennan Hospital · Packaging, Regulatory Labels, and Product Appearance

Product Visual Gallery

This gallery contains 4 technical images submitted to the FDA as part of the official labeling for Quetiapine Fumarate (NDC 69189-0495). Unlike standard consumer photos, these assets often include clinical data figures, molecular chemical structures, and official manufacturer packaging layouts.

As provided by Avera Mckennan Hospital, these visuals offer a comprehensive scientific overview of the product's physical and chemical identity, aiding pharmacists and researchers in product verification and study.

FDA Label Image

Quetiapine 400 mg Tablet (6918904951)

Quetiapine 400 mg Tablet (6918904951)
A white medication packet for Quetiapine 400 mg tablets from Avera McKennan Hospital in Sioux Falls, SD. The label states the manufacturer as Roxane and includes manufacturing and hospital lot numbers, an expiration date of 01/25/2017, and the product NDC 69189-0495.*
FDA Label Image

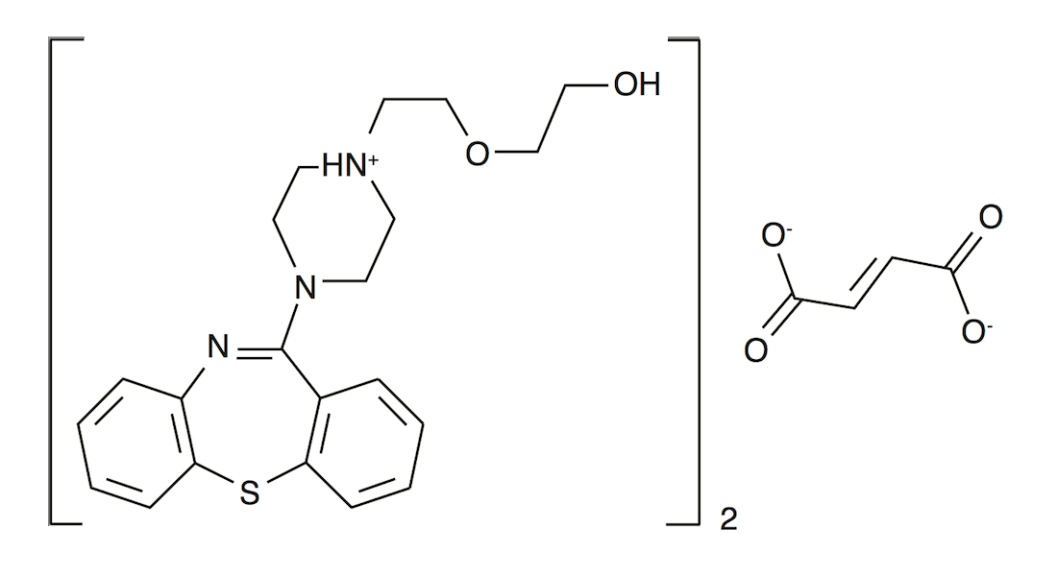
Quetiapine Chemical Structure.jpg (Image 01)

Quetiapine Chemical Structure.jpg (Image 01)
Chemical structure diagram of Quetiapine Fumarate showing the molecular arrangement of the quetiapine moiety and the fumarate moiety. The quetiapine component features a dibenzothiazepine core with a piperazine ring, and the fumarate component is depicted as a dicarboxylate ion.*
FDA Label Image

I:\dra-ma\labeling\xml Files\quetiapine Fumarate Tablets\labels\quetiapine Figure 1.jpg (Image 02)

I:\dra-ma\labeling\xml Files\quetiapine Fumarate Tablets\labels\quetiapine Figure 1.jpg (Image 02)
A line graph depicting the proportion of patients with relapse (%) over time in weeks. The graph compares two groups indicated by different line styles: a dashed line for QTP+LI/VAL and a solid line for PLA+LI/VAL. The x-axis represents time in weeks, and the y-axis represents the proportion of patients with relapse as a percentage.*
FDA Label Image

I:\dra-ma\labeling\xml Files\quetiapine Fumarate Tablets\labels\quetiapine Figure 2.jpg (Image 03)

I:\dra-ma\labeling\xml Files\quetiapine Fumarate Tablets\labels\quetiapine Figure 2.jpg (Image 03)
A Kaplan-Meier curve chart showing the proportion of patients with relapse (%) over time (weeks) up to 100 weeks. Two groups are compared: QTP+LI/VAL (dashed line) and PLA+LI/VAL (solid line). The chart illustrates relapse rates increasing over time for both groups, with the PLA+LI/VAL group showing a higher proportion of relapse.*

* About these descriptions: Image descriptions on this page are generated by automated AI analysis of the product label images from the manufacturer's FDA label submission (SPL). They are provided for reference only and may contain errors or omissions. Always rely on the printed label itself and the official FDA labeling, and consult a pharmacist or healthcare professional with any questions about this product.