Tikosyn
Product Images NDC 69189-5800

8 FDA label images from Avera Mckennan Hospital · Packaging, Regulatory Labels, and Product Appearance

Product Visual Gallery

This gallery contains 8 technical images submitted to the FDA as part of the official labeling for Tikosyn (NDC 69189-5800). Unlike standard consumer photos, these assets often include clinical data figures, molecular chemical structures, and official manufacturer packaging layouts.

As provided by Avera Mckennan Hospital, these visuals offer a comprehensive scientific overview of the product's physical and chemical identity, aiding pharmacists and researchers in product verification and study.

FDA Label Image

Dofetilide 0.125 mg Capsule (6918958001)
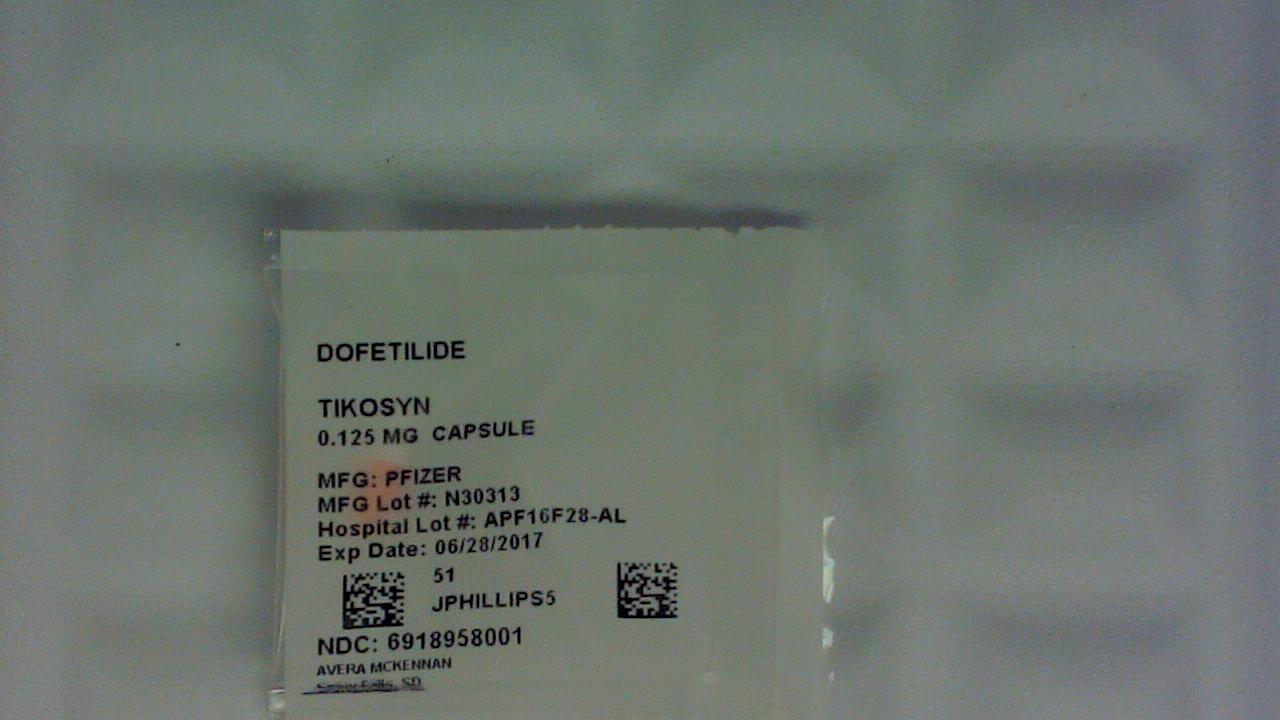
Dofetilide 0.125 mg Capsule (6918958001)
Packaging label for Tikosyn 0.125 mg capsule containing dofetilide. The label shows the manufacturer as Pfizer and includes manufacturing and hospital lot numbers, along with an expiration date of 06/28/2017. The product is labeled by Avera McKennan Hospital with NDC 69189-5800-01.*
FDA Label Image

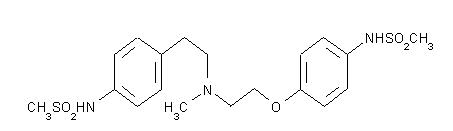
Chemical Structure (Tikosyn 01)

Chemical Structure (Tikosyn 01)
Chemical structure of the active ingredient in Tikosyn, showing the molecular arrangement with different chemical groups including methylsulfonamide and methoxy substituents connected to aromatic rings.*
FDA Label Image

Figure 1 (Tikosyn 02)

Figure 1 (Tikosyn 02)
A scatter plot showing the mean change from baseline QTc in milliseconds versus mean plasma dofetilide concentration in ng/mL for Tikosyn. Data points represent Day 1 (open squares) and Day 23 steady state (solid diamonds), with linear trend lines fitted for each time point illustrating the relationship between dofetilide plasma concentration and QTc change.*
FDA Label Image

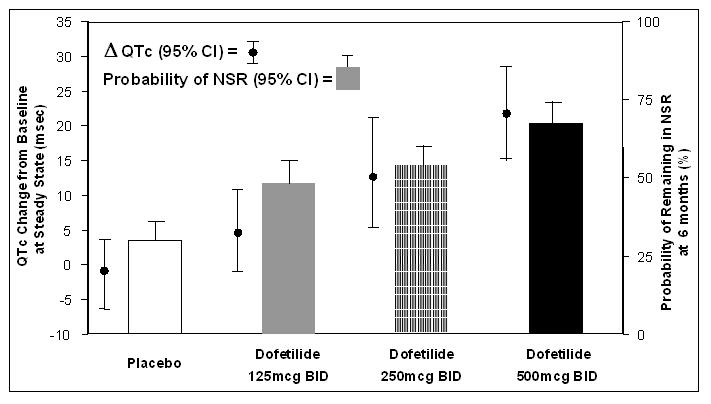
Figure 2 (Tikosyn 03)

Figure 2 (Tikosyn 03)
A bar and dot graph displaying QTc change from baseline at steady state and the probability of remaining in NSR at 6 months for placebo and three dosages of Dofetilide (125 mcg BID, 250 mcg BID, 500 mcg BID). The y-axis on the left shows QTc change in milliseconds, and the y-axis on the right shows the probability percentage of remaining in NSR. Bars represent probability of NSR with 95% confidence intervals, and dots with error bars indicate QTc changes with 95% confidence intervals.*
FDA Label Image

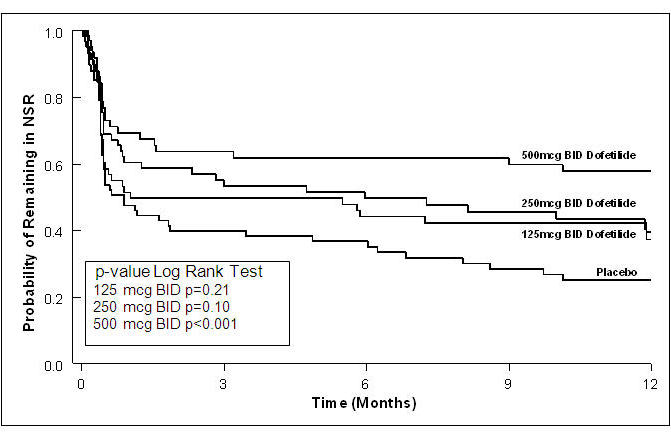
Figure 3 (Tikosyn 04)

Figure 3 (Tikosyn 04)
A Kaplan-Meier survival curve chart showing the probability of remaining in normal sinus rhythm (NSR) over 12 months for different doses of dofetilide (125 mcg, 250 mcg, and 500 mcg twice daily) compared to placebo. The chart includes p-values from a log-rank test for each dosage group against placebo.*
FDA Label Image

Figure 4 (Tikosyn 05)

Figure 4 (Tikosyn 05)
A Kaplan-Meier survival curve chart showing the probability of remaining in normal sinus rhythm (NSR) over 12 months, comparing placebo versus three doses of dofetilide (125 mcg, 250 mcg, and 500 mcg twice daily). The chart includes p-values from a log-rank test indicating statistical significance for all dofetilide doses compared to placebo.*
FDA Label Image

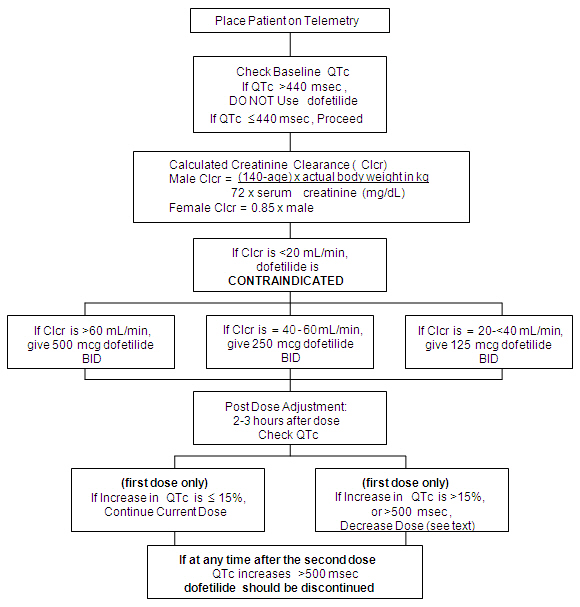
Flow Chart (Tikosyn 06)

Flow Chart (Tikosyn 06)
A dosing adjustment flowchart for Tikosyn (dofetilide) showing steps to initiate therapy starting with patient telemetry monitoring and baseline QTc check. It details creatinine clearance (Clcr) calculation, dosing recommendations based on Clcr ranges, and instructions for post-dose QTc evaluation leading to dose continuation, reduction, or discontinuation.*
FDA Label Image

Logo (Tikosyn 07)

* About these descriptions: Image descriptions on this page are generated by automated AI analysis of the product label images from the manufacturer's FDA label submission (SPL). They are provided for reference only and may contain errors or omissions. Always rely on the printed label itself and the official FDA labeling, and consult a pharmacist or healthcare professional with any questions about this product.