Not Applicable
Product Images NDC 69336-112

View Photos of Packaging, Regulatory Labels, and Product Appearance

Product Visual Gallery

This gallery contains 15 technical images submitted to the FDA as part of the official labeling for Not Applicable (NDC 69336-112). Unlike standard consumer photos, these assets often include clinical data figures, molecular chemical structures, and official manufacturer packaging layouts.

As provided by Sterling Knight Pharmaceuticals Llc, these visuals offer a comprehensive scientific overview of the product's physical and chemical identity, aiding pharmacists and researchers in product verification and study.

FDA Label Image

Image Description (Omeprazolelabel)
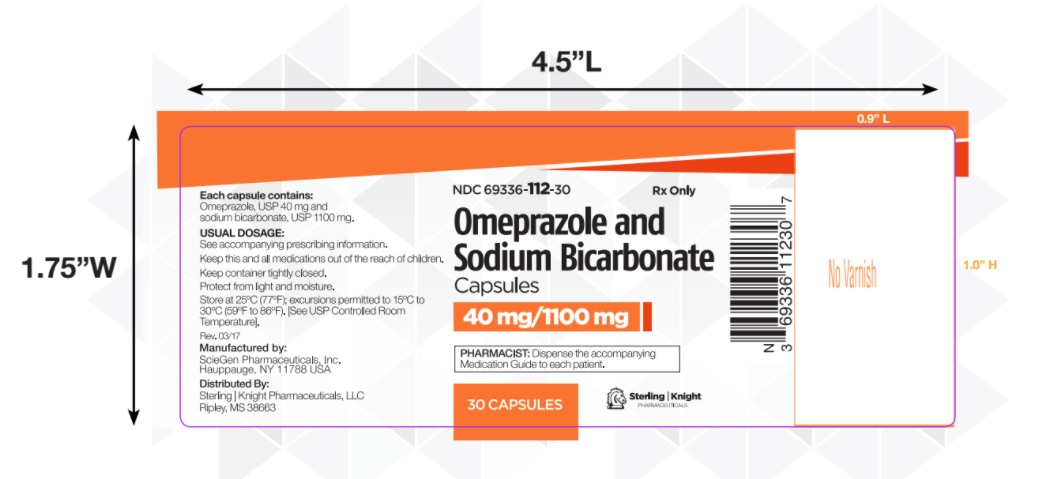
Image Description (Omeprazolelabel)
Label for Omeprazole and Sodium Bicarbonate capsules, 40 mg/1100 mg strength, in a package of 30 capsules. The label includes the NDC number 69336-112-30, prescription-only status, dosage information, storage instructions, and manufacturer details. It is labeled by Sterling Knight Pharmaceuticals LLC.*
FDA Label Image

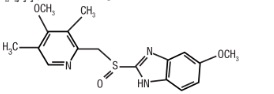
Structure (Structure)

Structure (Structure)
Chemical structure diagram of the active ingredient for the product labeled by Sterling Knight Pharmaceuticals LLC with NDC 69336-112. The diagram shows a complex molecule featuring a pyridine ring, methoxy substituents, and sulfur atoms connected to an amide group attached to a benzene ring with another methoxy group.*
FDA Label Image

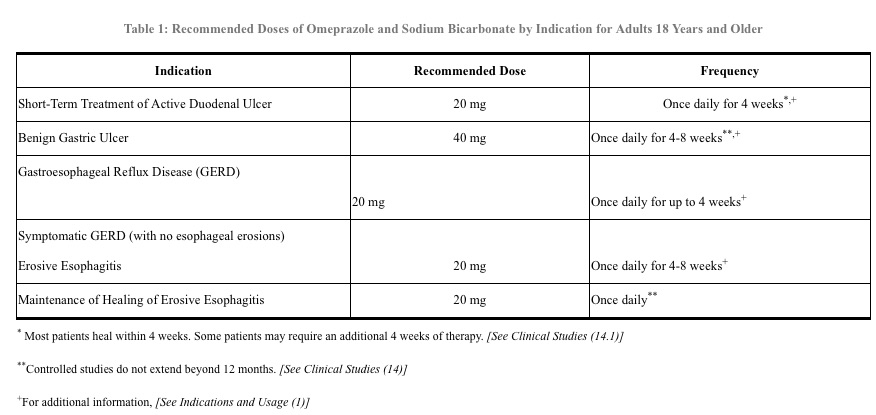
Table1 (Table1)

Table1 (Table1)
A table titled 'Recommended Doses of Omeprazole and Sodium Bicarbonate by Indication for Adults 18 Years and Older' showing various indications such as active duodenal ulcer, benign gastric ulcer, and GERD. It lists recommended doses (mostly 20 mg or 40 mg) and frequency of use, including once daily for specified weeks. Footnotes reference further clinical study details.*
FDA Label Image

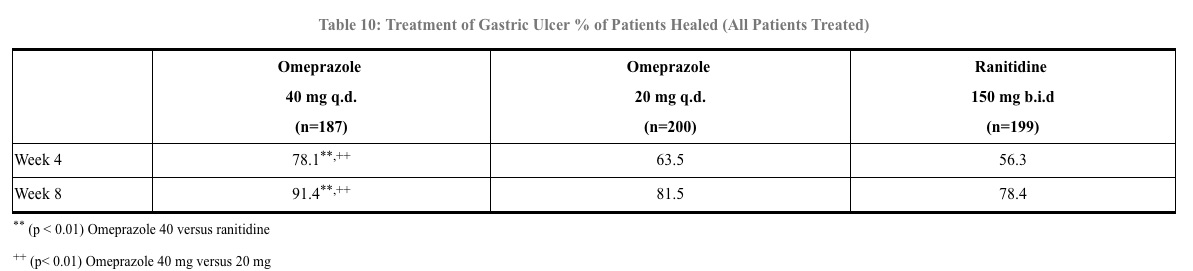
Tab10 (Table10)

Tab10 (Table10)
A table titled 'Treatment of Gastric Ulcer % of Patients Healed (All Patients Treated)' comparing the healing percentages at Week 4 and Week 8 for three treatments: Omeprazole 40 mg q.d. (n=187), Omeprazole 20 mg q.d. (n=200), and Ranitidine 150 mg b.i.d. (n=199). The table shows higher healing rates for Omeprazole 40 mg compared to the other treatments, with statistical significance noted.*
FDA Label Image

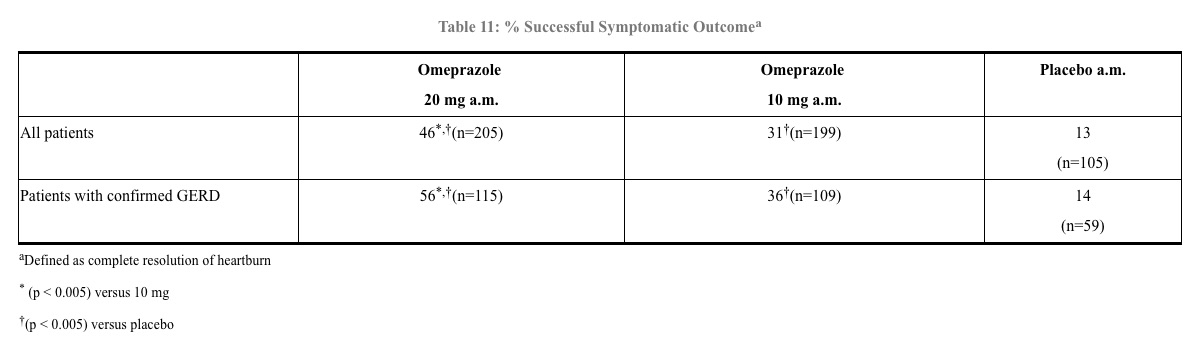
Tab11 (Table11)

Tab11 (Table11)
A data table titled '% Successful Symptomatic Outcome' comparing the percentage of patients with complete resolution of heartburn. It shows outcomes for Omeprazole 20 mg a.m., Omeprazole 10 mg a.m., and Placebo a.m. in all patients and patients with confirmed GERD, with sample sizes for each group and statistical significance notes.*
FDA Label Image

Tab12 (Table12)

Tab12 (Table12)
A data table titled 'Table 12: % Patients Healed' presenting healing percentages for Omeprazole 40 mg, Omeprazole 20 mg, and placebo groups at weeks 4 and 8. The table compares patient counts and healing percentages, highlighting statistically significant differences between Omeprazole and placebo groups.*
FDA Label Image

Tab13 (Table13)

Tab13 (Table13)
A data table titled 'Table 13: Life Table Analysis' showing the percent in endoscopic remission at 6 months for three groups: Omeprazole 20 mg once daily (70%), Omeprazole 20 mg three days per week (34%), and placebo (11%). Sample sizes for each group are 138, 137, and 131, respectively.*
FDA Label Image

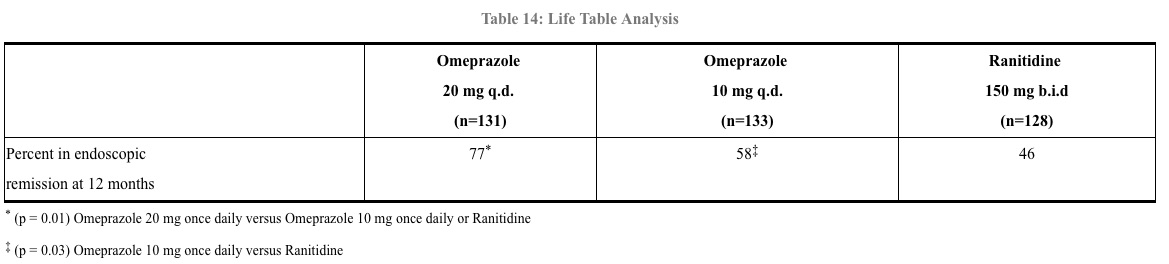
Tab14 (Table14)

Tab14 (Table14)
A data table titled 'Table 14: Life Table Analysis' comparing three treatment groups: Omeprazole 20 mg once daily, Omeprazole 10 mg once daily, and Ranitidine 150 mg four times daily. It shows the percent in endoscopic remission at 12 months for each group with associated sample sizes (n=131, n=133, and n=128 respectively) and footnotes indicating p-values for statistical comparisons.*
FDA Label Image

Table2 (Table2)

Table2 (Table2)
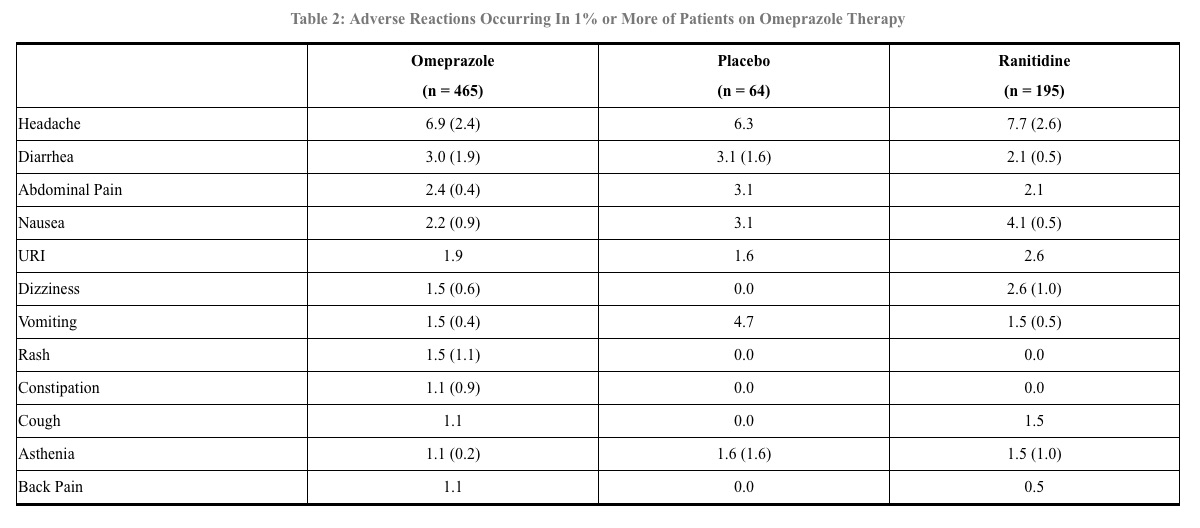
A table titled 'Adverse Reactions Occurring In 1% or More of Patients on Omeprazole Therapy' comparing the incidence of various adverse reactions among three groups: Omeprazole (465 patients), Placebo (64 patients), and Ranitidine (195 patients). The table lists reactions such as headache, diarrhea, abdominal pain, nausea, URI, dizziness, vomiting, rash, constipation, cough, asthenia, and back pain with corresponding percentages for each treatment group.*
FDA Label Image

Table3 (Table3)

Table3 (Table3)
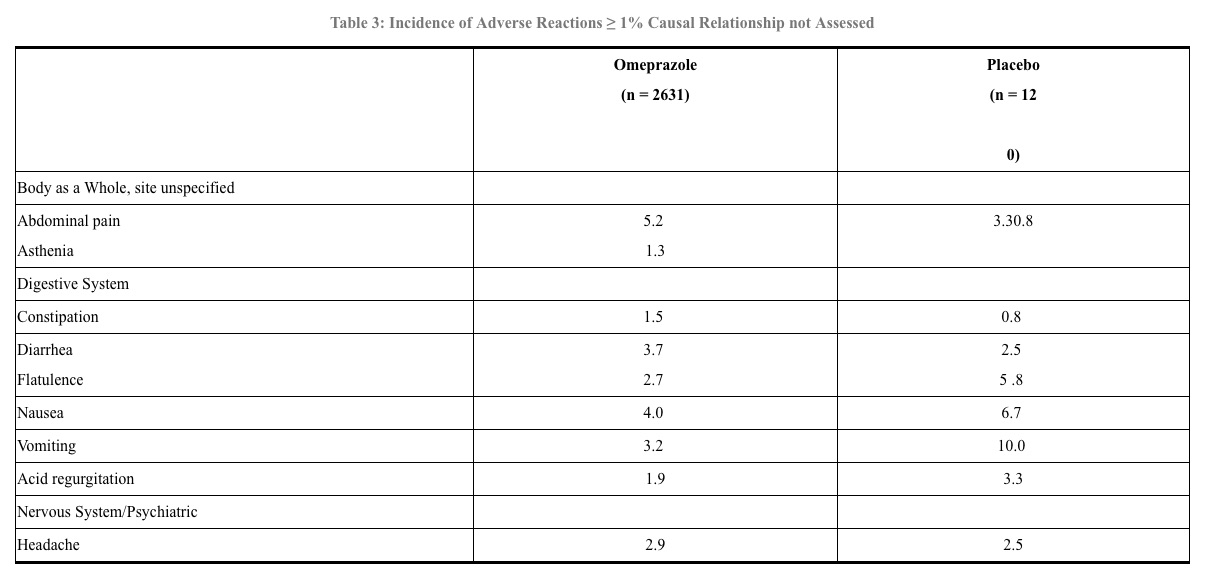
A table titled 'Incidence of Adverse Reactions ≥ 1% Causal Relationship not Assessed' comparing the frequency of various adverse reactions between Omeprazole (n=2631) and placebo (n=120). Reactions listed include abdominal pain, asthenia, constipation, diarrhea, flatulence, nausea, vomiting, acid regurgitation, and headache with their respective percentages for both groups.*
FDA Label Image

Table5 (Table5)

Table5 (Table5)
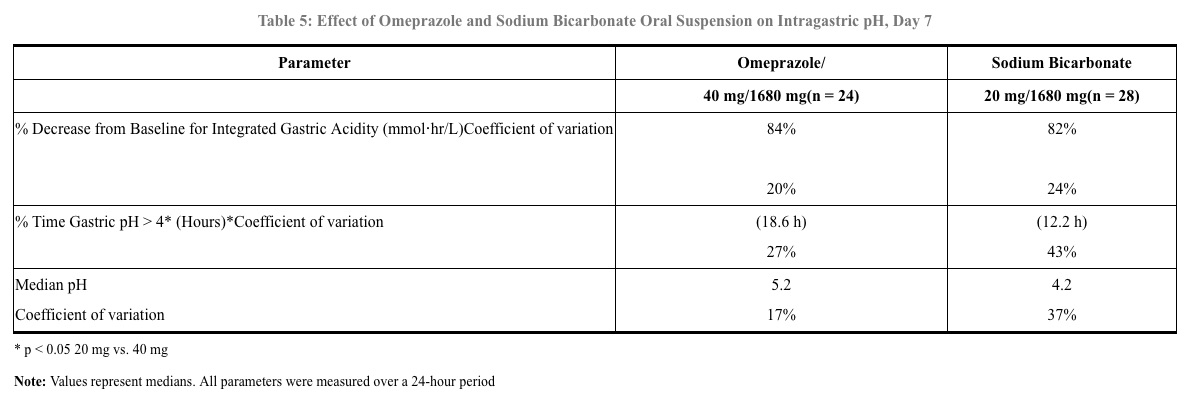
Table showing the effect of Omeprazole and Sodium Bicarbonate oral suspension on intragastric pH on day 7. It lists parameters such as percent decrease from baseline for integrated gastric acidity, percent time gastric pH > 4, median pH, and coefficient of variation for Omeprazole (40 mg/1680 mg, n=24) and Sodium Bicarbonate (20 mg/1680 mg, n=28). Values represent medians measured over a 24-hour period with statistical notes included.*
FDA Label Image

Tab6 (Table6)

Tab6 (Table6)
A data table titled 'Treatment of Active Duodenal Ulcer % of Patients Healed' comparing healing percentages between Omeprazole 20 mg a.m. (n=99) and placebo a.m. (n=48) at Week 2 and Week 4. Omeprazole shows 41% and 75% healing, while placebo shows 13% and 27%, respectively, with significance noted at p ≤ 0.01.*
FDA Label Image

Tab7 (Table7)

Tab7 (Table7)
A data table titled 'Treatment of Active Duodenal Ulcer % of Patients Healed' comparing healing percentages at weeks 2 and 4 between Omeprazole 20 mg a.m. (145 patients) and Ranitidine 150 mg b.i.d (148 patients). The table shows higher healing rates for Omeprazole at both time points, with a statistically significant result at week 4 (82%).*
FDA Label Image

Tab8 (Table8)

Tab8 (Table8)
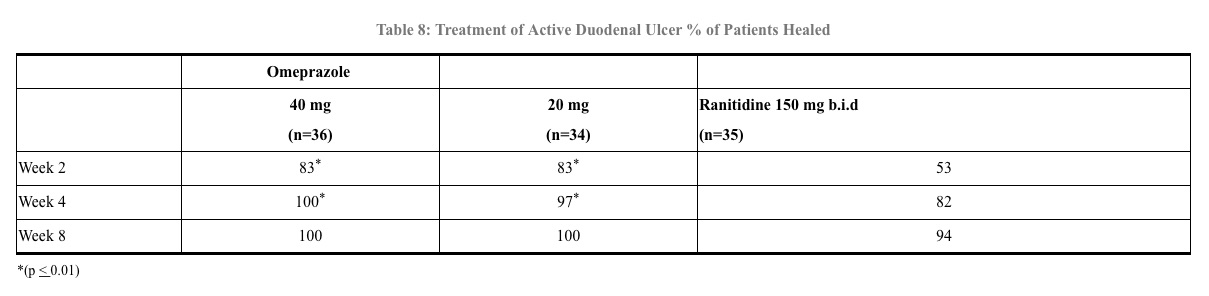
A data table titled 'Treatment of Active Duodenal Ulcer % of Patients Healed' comparing healing percentages at Weeks 2, 4, and 8 among patients treated with Omeprazole 40 mg, Omeprazole 20 mg, and Ranitidine 150 mg b.i.d. The table shows patient counts for each group and healing rates, with a statistical note for Omeprazole doses at some points.*
FDA Label Image

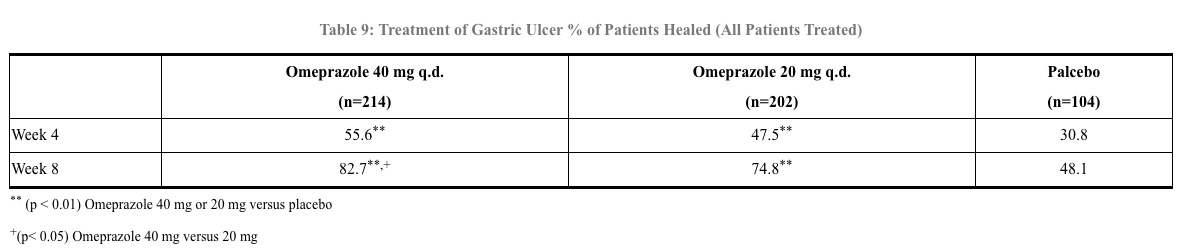
Tab9 (Table9)

Tab9 (Table9)
A table titled 'Treatment of Gastric Ulcer % of Patients Healed (All Patients Treated)' comparing healing percentages at weeks 4 and 8 for Omeprazole 40 mg, Omeprazole 20 mg, and placebo groups. It includes patient counts for each group and statistical significance notes for comparisons between treatments and placebo.*

* About these descriptions: Image descriptions on this page are generated by automated AI analysis of the product label images from the manufacturer's FDA label submission (SPL). They are provided for reference only and may contain errors or omissions. Always rely on the printed label itself and the official FDA labeling, and consult a pharmacist or healthcare professional with any questions about this product.