Levetiracetam Solution
Product Images NDC 69339-157

8 FDA label images from Natco Pharma Usa Llc · Packaging, Regulatory Labels, and Product Appearance

Product Visual Gallery

This gallery contains 8 technical images submitted to the FDA as part of the official labeling for Levetiracetam (NDC 69339-157). Unlike standard consumer photos, these assets often include clinical data figures, molecular chemical structures, and official manufacturer packaging layouts.

As provided by Natco Pharma Usa Llc, these visuals offer a comprehensive scientific overview of the product's physical and chemical identity, aiding pharmacists and researchers in product verification and study.

FDA Label Image

Structural Formula (Lev1r 0000 01)

Structural Formula (Lev1r 0000 01)
Chemical structure diagram of levetiracetam, showing its molecular formula with a pyrrolidinone ring and associated groups consistent with the active ingredient levetiracetam.*
FDA Label Image

Figure 1 (Lev1r 0000 02)

Figure 1 (Lev1r 0000 02)
A bar graph comparing the percentage of responders across three groups: Placebo, Levetiracetam 1,000 mg/day, and Levetiracetam 3,000 mg/day. The graph shows responder rates approximately at 7.4% for placebo, 37.1% for Levetiracetam 1,000 mg/day, and 39.6% for Levetiracetam 3,000 mg/day, with a note indicating statistical significance versus placebo.*
FDA Label Image

Figure 2 (Lev1r 0000 03)

Figure 2 (Lev1r 0000 03)
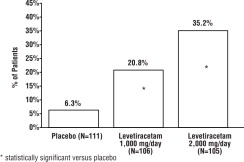
Bar chart showing the percentage of patients with 6-month seizure freedom across three groups: placebo (6.3%), Levetiracetam 1,000 mg/day (20.8%), and Levetiracetam 2,000 mg/day (35.2%). Statistically significant differences versus placebo are indicated.*
FDA Label Image

Figure 3 (Lev1r 0000 04)

Figure 3 (Lev1r 0000 04)
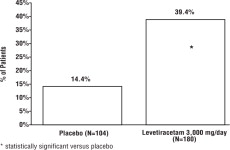
A bar chart comparing the percent of patients with a specific response between two groups: Placebo (N=104) and Levetiracetam 3,000 mg/day (N=180). The Levetiracetam group shows a higher response rate of 39.4% compared to 14.4% for the placebo group. Statistical significance is indicated by an asterisk above the Levetiracetam bar.*
FDA Label Image

Figure 4 (Lev1r 0000 05)

Figure 4 (Lev1r 0000 05)
Bar chart comparing the percentage of patients between placebo and Levetiracetam groups. The Levetiracetam bar shows a higher percentage of patients around 44.6%, marked as statistically significant versus placebo, which shows about 19.6%, based on sample sizes of 97 and 101 respectively.*
FDA Label Image

Figure 5 (Lev1r 0000 06)

Figure 5 (Lev1r 0000 06)
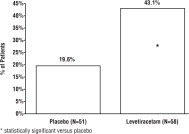
Bar chart comparing the percentage of patients between Placebo and Levetiracetam groups, showing 19.6% for Placebo (N=61) and 43.1% for Levetiracetam (N=58). The chart includes a marker indicating a statistically significant difference between the groups.*
FDA Label Image

Figure 6 (Lev1r 0000 07)

Figure 6 (Lev1r 0000 07)
A vertical bar graph comparing percentage outcomes between placebo and Levetiracetam groups. The Y-axis shows percentages ranging from 0% to 90%. The placebo group (N=84) shows approximately 46.2%, while the Levetiracetam group (N=78) shows approximately 72.2%, with an asterisk indicating statistical significance versus placebo.*
FDA Label Image

Principal Display Panel (5 mL Unit Dose Cup Label)

Principal Display Panel (5 mL Unit Dose Cup Label)
Levetiracetam oral solution USP 500 mg/5 mL bottle label by Natco Pharma USA LLC. The label states a 5 mL delivery volume with NDC 69339-157-05. It is for institutional use only, with batch and expiration date placeholders. Manufacturer listed as DASH Pharmaceuticals LLC, Upper Saddle River, NJ.*

* About these descriptions: Image descriptions on this page are generated by automated AI analysis of the product label images from the manufacturer's FDA label submission (SPL). They are provided for reference only and may contain errors or omissions. Always rely on the printed label itself and the official FDA labeling, and consult a pharmacist or healthcare professional with any questions about this product.