Paclitaxel Injection, Solution
Product Images NDC 69339-227

View Photos of Packaging, Regulatory Labels, and Product Appearance

Product Visual Gallery

This gallery contains 33 technical images submitted to the FDA as part of the official labeling for Paclitaxel (NDC 69339-227). Unlike standard consumer photos, these assets often include clinical data figures, molecular chemical structures, and official manufacturer packaging layouts.

As provided by Natco Pharma Usa Llc, these visuals offer a comprehensive scientific overview of the product's physical and chemical identity, aiding pharmacists and researchers in product verification and study.

FDA Label Image

100mg (100 mg Label)
100mg (100 mg Label)
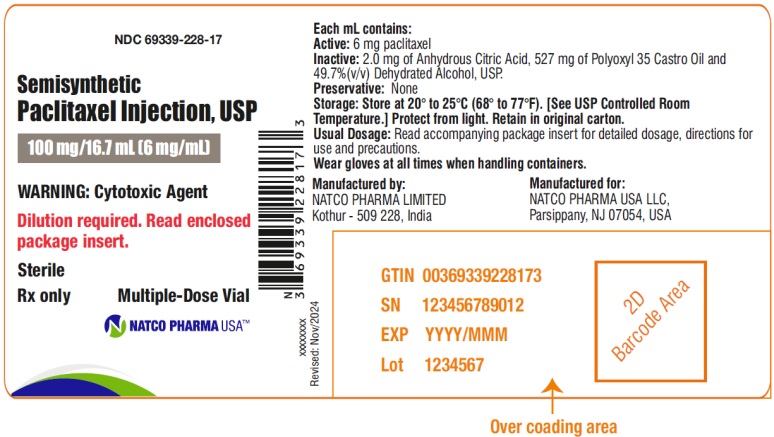
Label for Semisynthetic Paclitaxel Injection, USP 100 mg/16.7 mL (6 mg/mL) multiple-dose vial. Includes warnings of cytotoxicity and dilution requirement, storage instructions at 20° to 25°C, and details about manufacturer Natco Pharma USA LLC. Lists active ingredient paclitaxel 6 mg/mL and inactive ingredients. Specifies sterile, prescription use only.*
FDA Label Image

100mg Carton (100mg Canton)

100mg Carton (100mg Canton)
Label for Paclitaxel Injection, USP 6 mg/mL (100 mg/16.7 mL) intravenous injection by Natco Pharma USA LLC. The label includes warnings for cytotoxicity, dilution instructions, storage conditions (20° to 25°C), and usage precautions, indicating it is sterile, Rx only, and a multiple-dose vial. The label also lists inactive ingredients, manufacturer details, barcodes, and a note to wear gloves when handling.*
FDA Label Image

300mg Carton (300mg Carton)

300mg Carton (300mg Carton)
Packaging label for Paclitaxel Injection, USP 300 mg/50 mL (6 mg/mL) intravenous injection. The label indicates it is a semi-synthetic, sterile, multiple-dose vial for prescription use only. It includes warnings about cytotoxicity and storage instructions. Manufactured by Natco Pharma USA LLC with manufacturing details from India.*
FDA Label Image

300mg (300mg Label)

300mg (300mg Label)
Label for Semisynthetic Paclitaxel Injection, USP 300 mg/50 mL (6 mg/mL) intravenous injection solution by Natco Pharma USA LLC. The label highlights cytotoxic warnings, dilution instructions, sterile status, prescription-only use, and multiple-dose vial information. It lists active ingredient concentration and additives, storage conditions, handling precautions, manufacturer details, and barcode area.*
FDA Label Image

30mg Carton (30mg Carton)

30mg Carton (30mg Carton)
Packaging label for Paclitaxel Injection, USP 30 mg/5 mL (6 mg/mL) solution for intravenous use. The label identifies the product as a sterile, semisynthetic, cytotoxic agent requiring dilution and enclosed package insert. Manufactured by Natco Pharma Limited, India, and labeled for Natco Pharma USA LLC. The vial is a multiple-dose type with warnings for safe handling and storage at 20° to 25°C.*
FDA Label Image

30mg (30mg Label)

30mg (30mg Label)
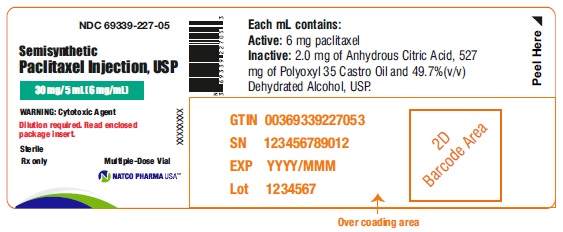
Label for Paclitaxel Injection, USP, 30 mg/5 mL (6 mg/mL) intravenous injection solution. The label includes active ingredient concentration, inactive ingredients, warnings about cytotoxicity, dosage form as a multiple-dose vial, and indicates Natco Pharma USA LLC as the labeler. It also features a barcode area and typical labeling details such as NDC, GTIN, serial number, expiration, and lot number placeholders.*
FDA Label Image

Figure-1 (Fig1)

Figure-1 (Fig1)
A Kaplan-Meier survival curve chart comparing the proportion surviving over a 5-year period between two groups labeled Cc and Tc. The vertical axis represents the proportion surviving from 0 to 1, and the horizontal axis represents time in years from 0 to 5. The chart includes a table showing number of participants (N), events, and hazard ratio (HR) with 95% confidence interval for each group. Below the chart, the number at risk is indicated for both groups at yearly intervals.*
FDA Label Image

Figure 2 (Fig2)

Figure 2 (Fig2)
A survival curve chart displaying the proportion of patients surviving over a period of 5 years. Two groups labeled 'Cc' and 'Tc' are shown with distinct survival curves. The x-axis represents years, and the y-axis shows the proportion surviving from 0 to 1. A small inset table provides sample sizes and hazard ratio with confidence intervals for each group.*
FDA Label Image

Figure 3 (Fig3)

Figure 3 (Fig3)
A Kaplan-Meier survival curve chart showing proportion disease-free over time (years), comparing two groups labeled AC and AC+T. The chart includes the number of patients at risk at various time points, number of events, and a hazard ratio with confidence interval in an inset table.*
FDA Label Image

Figure-4 (Fig4)

Figure-4 (Fig4)
A survival curve chart depicting the proportion surviving over a period of 4 years comparing two groups labeled AC and AC+T. The chart includes a data table with sample sizes, number of events, hazard ratio (HR), and 95% confidence interval (CI), along with the number of subjects at risk at different time points for each group.*
FDA Label Image

Figure 5 (Fig5)

Figure 5 (Fig5)
A Kaplan-Meier survival curve chart showing the proportion of patients disease free over a 4-year period. Two groups are compared: AC and AC+T. The y-axis represents the proportion disease free, ranging from 0 to 1, and the x-axis shows years from 0 to 4. A summary table within the chart lists the number of patients, number of events, hazard ratio (HR), and confidence interval (CI) for each group, along with a table showing the number of patients at risk at various time points.*
FDA Label Image

Figure-6 (Fig6)

Figure-6 (Fig6)
A Kaplan-Meier curve chart showing proportion disease-free over time in years, comparing two groups labeled AC and AC+T. The chart includes a table with numbers of subjects, events, hazard ratio (HR), and 95% confidence interval (CI) for each group. The x-axis represents years from 0 to 4, and the y-axis shows the proportion disease free from 0 to 1.*
FDA Label Image

Figure-7 (Fig7)

Figure-7 (Fig7)
A Kaplan-Meier survival curve chart showing the proportion of disease-free individuals over a period of 4 years, comparing two groups labeled AC and AC+T. The graph includes a table with sample sizes, number of events, hazard ratio (HR), 95% confidence interval (CI), and the number at risk across different time points for each group.*
FDA Label Image

Figure-8 (Fig8)

Figure-8 (Fig8)
A line graph showing the proportion of patients disease-free over a span of 4 years, comparing two treatment groups labeled AC and AC+T. The y-axis represents the proportion disease free, and the x-axis represents time in years. The graph includes a table of events, hazard ratio (HR), confidence interval, and number of patients at risk for each group over time.*
FDA Label Image

Structure (Structure)

Structure (Structure)
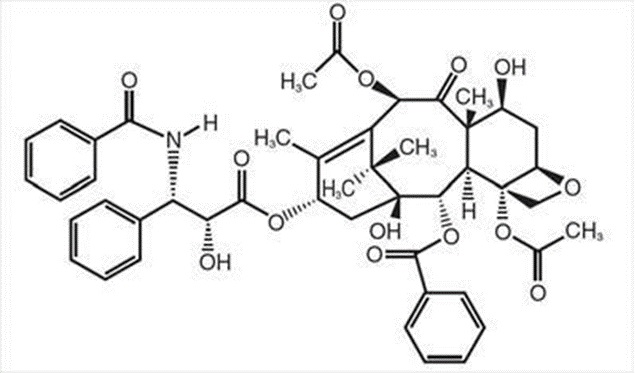
Chemical structure of paclitaxel, showing the detailed molecular arrangement including multiple aromatic rings, ester and hydroxyl functional groups, and chiral centers.*
FDA Label Image

Table 1 (Tab1)

Table 1 (Tab1)
A data table presenting pharmacokinetic parameters of Paclitaxel injection solution including dose (mg/m²), infusion duration (hours), number of patients, maximum plasma concentration (Cmax ng/mL), area under the plasma concentration-time curve (AUC), half-life (T-HALF in hours), and total body clearance (CLT L/h/m²). The table compares results across different doses and infusion durations.*
FDA Label Image

Table 10 (Tab10)

Table 10 (Tab10)
Table listing adverse reaction frequency in patients (n=812) treated with Paclitaxel. It covers bone marrow effects, hypersensitivity reactions, cardiovascular events, abnormal ECG, peripheral neuropathy, myalgia/arthralgia, gastrointestinal issues, alopecia, hepatic enzyme elevations, and injection site reactions, showing associated percent of patients affected.*
FDA Label Image

Table 11 (Tab11)

Table 11 (Tab11)
A data table presenting the percent of patients experiencing various adverse effects during clinical studies comparing different dosing regimens of Paclitaxel and other agents. Categories include Bone Marrow effects, Hypersensitivity Reaction, Neurotoxicity, Nausea and Vomiting, Myalgia/Arthralgia, Diarrhea, Asthenia, and Alopecia, with severity distinctions where noted.*
FDA Label Image

Table 12 (Tab12)

Table 12 (Tab12)
A data table presenting percentages of patients experiencing various side effects such as bone marrow issues (neutropenia, thrombocytopenia, anemia), hypersensitivity reactions, peripheral neuropathy, and mucositis, across different Paclitaxel dose groups (175/3, 175/24, 135/3, 135/24 mg/m2 infusion durations). The table includes notes on analysis basis, dosing, premedication, and severity definitions.*
FDA Label Image

Table 13 (Tab13)

Table 13 (Tab13)
Table presenting the percentage of patients experiencing various adverse events in early and total populations treated with cyclophosphamide and doxorubicin (AC) alone or followed by paclitaxel (T), including data on bone marrow effects, hypersensitivity reactions, cardiovascular events, and other toxicities.*
FDA Label Image

Table 14 (Tab14)

Table 14 (Tab14)
A data table presenting percentages of patients experiencing various side effects and toxicities categorized by dose groups (175/3 and 135/3) for a drug. It includes categories such as Bone Marrow effects (neutropenia, thrombocytopenia, anemia), Hypersensitivity Reactions, Peripheral Neuropathy, and Mucositis with detailed severity levels and notes on premedication and analysis.*
FDA Label Image

Table 15 (Tab15)

Table 15 (Tab15)
A data table summarizing the percent of patients experiencing various adverse events related to bone marrow, hypersensitivity reactions, arthralgia/myalgia, nausea/vomiting, mucositis, neuromotor and neurosensory toxicity, and cardiovascular events. The data compares three treatment groups labeled T135/24c75, T250/24c75, and VP100d c75, with details on severity of symptoms and footnotes explaining dosing and definitions.*
FDA Label Image

Table 16 (Tab16)

Table 16 (Tab16)
A data table presenting percentages of patients experiencing various adverse effects and drug toxicity discontinuation in two clinical studies (CA139-174 and CA139-281) of Paclitaxel injection solution. Categories include bone marrow effects, opportunistic infections, hypersensitivity reactions, cardiovascular symptoms, peripheral neuropathy, myalgia/arthralgia, gastrointestinal issues, renal creatinine elevation, and discontinuation due to toxicity.*
FDA Label Image

Table 17 (Tab17)

Table 17 (Tab17)
A data table outlining Paclitaxel dosage recommendations according to the degree of hepatic impairment. It shows recommended doses for 24-hour and 3-hour infusion schedules based on transaminase levels and bilirubin levels. The table includes notes explaining dosage basis and criteria differences between infusion lengths.*
FDA Label Image

Table 2a (Tab2a)

Table 2a (Tab2a)
A data table presenting clinical study results comparing treatment groups with variables including clinical response rate, time to progression (median months), survival (median months), p-values, hazard ratios, and 95% confidence intervals. It covers two studies labeled Intergroup and GOG-111 with various dose groups and patient counts specified.*
FDA Label Image

Table 2b (Tab2b)

Table 2b (Tab2b)
A comparative data table presenting clinical response, time to progression, and survival statistics for two treatment groups labeled T175/3 and C750. It includes rates, median months, p-values, hazard ratios, and confidence intervals related to paclitaxel dose and associated chemotherapy drugs in patients with measurable disease.*
FDA Label Image

Table 3 (Tab3)

Table 3 (Tab3)
A data table presenting response rate percentages, median time to progression in months, and median survival in months with 95% confidence intervals for four patient groups defined as 175/3, 175/24, 135/3, and 135/24 with respective sample sizes.*
FDA Label Image

Tabel 4 (Tab4)

Tabel 4 (Tab4)
A data table presenting patient subsets categorized by number of positive nodes, tumor size, menopausal status, and receptor status. It shows the number of patients, recurrences, disease-free survival hazard ratios with 95% confidence intervals, number of deaths, and overall survival hazard ratios with 95% confidence intervals. Footnotes clarify receptor status definitions.*
FDA Label Image

Table 5 (Tab5)

Table 5 (Tab5)
A data table presenting clinical outcomes comparing two groups labeled 175/3 (n=235) and 135/3 (n=236). It shows response rates, median time to progression in months, and median survival in months, each with associated p-values.*
FDA Label Image

Table 6 (Tab6)

Table 6 (Tab6)
A data table comparing treatment outcomes for three chemotherapy regimens: TI 35/24 c75, T 250/24 c75, and VP 100 c75, with sample sizes and metrics including response rate (percent), time to progression (median months), survival (median months), and one-year survival (percent of patients). Footnotes clarify VP dosing and statistical comparisons.*
FDA Label Image

Table 7 (Tab7)

Table 7 (Tab7)
A data table presenting patient counts categorized by sites of systemic therapy involvement. The categories include visceral with edema plus oral and cutaneous involvement, edema or lymph nodes plus oral and cutaneous involvement, oral plus cutaneous involvement, and cutaneous involvement only. The column shows prior therapy counts with a total number of 59 patients.*
FDA Label Image

Table 8 (Tab8)

Table 8 (Tab8)
A data table presenting outcomes of systemic therapy for 59 subjects, listing complete response, partial response, stable disease, progression, and early death/toxicity with corresponding counts.*
FDA Label Image

Table 9 (Tab9)

Table 9 (Tab9)
A data table showing patient incidence percentages of neutropenia (Grade IV) and peripheral neuropathy (Grades III/IV) by age groups (≥65 and <65) across different cancer indications treated with Paclitaxel. Indications include ovarian cancer, adjuvant breast cancer, breast cancer after failure of initial therapy, and non-small cell lung cancer, with noted study regimens and statistical significance annotations.*

* About these descriptions: Image descriptions on this page are generated by automated AI analysis of the product label images from the manufacturer's FDA label submission (SPL). They are provided for reference only and may contain errors or omissions. Always rely on the printed label itself and the official FDA labeling, and consult a pharmacist or healthcare professional with any questions about this product.