Paricalcitol Capsule
Product Images NDC 69452-147

6 FDA label images from Bionpharma Inc. · Packaging, Regulatory Labels, and Product Appearance

Product Visual Gallery

This gallery contains 6 technical images submitted to the FDA as part of the official labeling for Paricalcitol (NDC 69452-147). Unlike standard consumer photos, these assets often include clinical data figures, molecular chemical structures, and official manufacturer packaging layouts.

As provided by Bionpharma Inc., these visuals offer a comprehensive scientific overview of the product's physical and chemical identity, aiding pharmacists and researchers in product verification and study.

FDA Label Image

1 Mcg Capsule Bottle Label (Image Label 001v2)
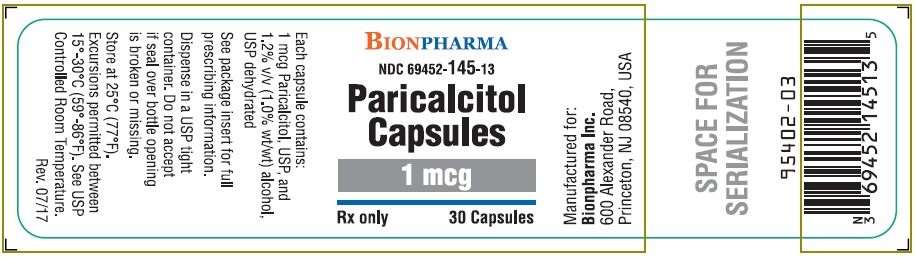
1 Mcg Capsule Bottle Label (Image Label 001v2)
Paricalcitol Capsules 1 mcg oral capsules label from Bionpharma Inc. The label shows the product name, strength (1 mcg), quantity of 30 capsules, Rx only status, and manufacturing details including address. It also includes storage instructions, a barcode, and a space designated for serialization.*
FDA Label Image

2 Mcg Capsule Bottle Label (Image Label 002v2)

2 Mcg Capsule Bottle Label (Image Label 002v2)
Paricalcitol Capsules 2 mcg oral dosage form in a carton label. The package contains 30 capsules and is manufactured by Bionpharma Inc., located in Princeton, NJ, USA. The label includes storage instructions, a barcode, and states the product is Rx only.*
FDA Label Image

4 Mcg Capsule Bottle Label (Image Label 003v2)

4 Mcg Capsule Bottle Label (Image Label 003v2)
Paricalcitol Capsules 4 mcg label from Bionpharma Inc. The label states the active ingredients and strength, container information with 30 capsules, storage conditions, and manufacturer details including address in Princeton, NJ. It features a barcode and space for serial number.*
FDA Label Image

Structural Formula (Paricalcitol 01)

Structural Formula (Paricalcitol 01)
Chemical structure of paricalcitol, a synthetic vitamin D analog used as an active ingredient in oral capsules for prescription use. The diagram depicts the arrangement of carbon, hydrogen, and oxygen atoms in the molecule.*
FDA Label Image

Figure 1 (Paricalcitol 02)

Figure 1 (Paricalcitol 02)
A line graph comparing the effects of Paricalcitol and Placebo on iPTH levels (pg/mL) over 23 weeks. The x-axis represents time in weeks, and the y-axis shows iPTH concentration. The Paricalcitol group shows a decreasing trend in iPTH levels, while the Placebo group's levels remain relatively stable or slightly increase.*
FDA Label Image

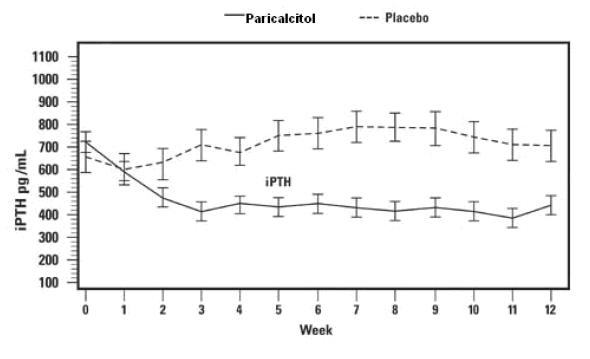
Figure 2 (Paricalcitol 03)

Figure 2 (Paricalcitol 03)
A line graph illustrating the change in intact parathyroid hormone (iPTH) levels over a 12-week period for Paricalcitol and Placebo groups. The y-axis represents iPTH concentration in pg/mL, ranging from 100 to 1100, and the x-axis shows weeks from 0 to 12. The Paricalcitol group shows a decreasing trend in iPTH, while the Placebo group shows an increasing trend with error bars for variability.*

* About these descriptions: Image descriptions on this page are generated by automated AI analysis of the product label images from the manufacturer's FDA label submission (SPL). They are provided for reference only and may contain errors or omissions. Always rely on the printed label itself and the official FDA labeling, and consult a pharmacist or healthcare professional with any questions about this product.