Image Description (Figure 01)

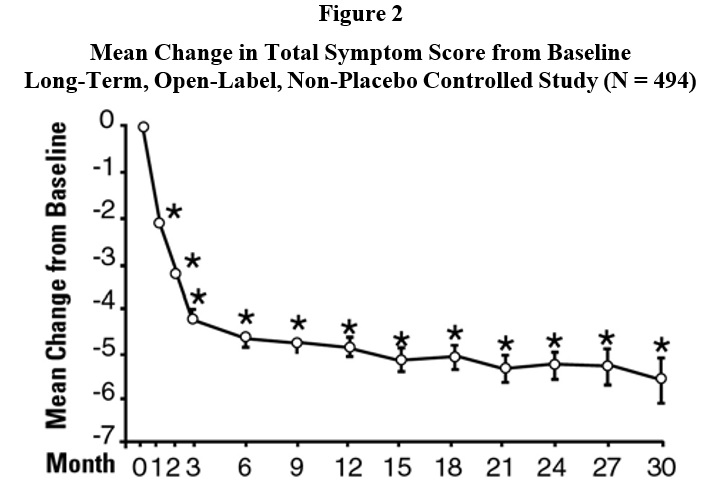
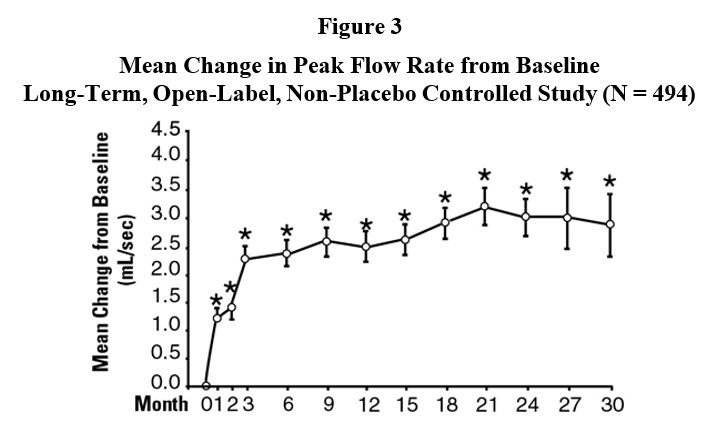
This text provides information on the mean change in total symptom score and the mean increase in peak flow rate (mL/sec) from baseline between the placebo and terazosin groups in a study. The study includes 54 participants and is represented graphically in Figure 1. Additionally, the data is presented over a 3-month period.*