Indocyanine Green Kit
Product Images NDC 70100-424

4 FDA label images from Renew Pharmaceuticals Limited · Packaging, Regulatory Labels, and Product Appearance

Product Visual Gallery

This gallery contains 4 technical images submitted to the FDA as part of the official labeling for Indocyanine Green (NDC 70100-424). Unlike standard consumer photos, these assets often include clinical data figures, molecular chemical structures, and official manufacturer packaging layouts.

As provided by Renew Pharmaceuticals Limited, these visuals offer a comprehensive scientific overview of the product's physical and chemical identity, aiding pharmacists and researchers in product verification and study.

FDA Label Image

Structural Formula (Image 01)
Structural Formula (Image 01)
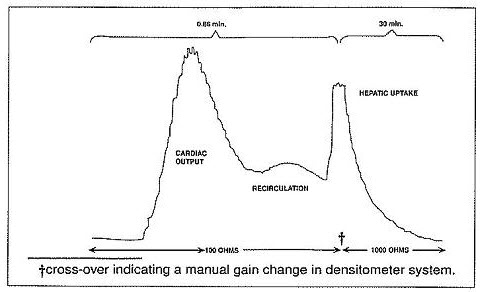
A pharmacokinetic curve depicting phases of Indocyanine Green activity including cardiac output, recirculation, and hepatic uptake. The x-axis is marked in ohms indicating densitometer system resistance levels, with annotations for manual gain change crossover points and time intervals of 0.85 and 30 minutes.*
FDA Label Image

Principal Display Panel (Vial)

Principal Display Panel (Vial)
A line graph depicting the optical density at 805 nm corresponding to sterile Indocyanine Green USP concentrations in serum after an injection dose of 0.5 mg/kg. The graph shows a linear increase of optical density with rising concentration, including a marked 20-minute normal range.*
FDA Label Image

Principal Display Panel (Sterile Water Label)

Principal Display Panel (Sterile Water Label)
A graph titled 'Excitation and Emission Spectra of Whole Blood Containing 0.05 mg/mL of Sterile Indocyanine Green, USP' showing two curves: an excitation curve peaking at 805 nm and an emission curve peaking at 835 nm, plotted on a wavelength axis ranging from 700 to 900 nm.*
FDA Label Image

Principal Display Panel (Carton)

Principal Display Panel (Carton)
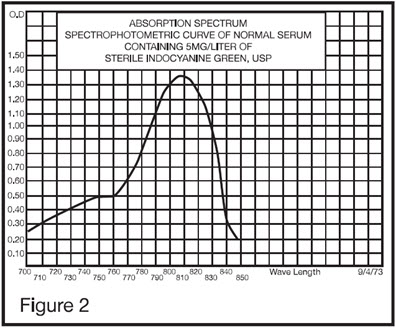
Absorption spectrum chart depicting the spectrophotometric curve of normal serum containing 5 mg/liter of sterile Indocyanine Green, USP. The graph plots optical density (O.D.) against wavelength in nanometers, showing a peak absorption between approximately 790 and 820 nm.*

* About these descriptions: Image descriptions on this page are generated by automated AI analysis of the product label images from the manufacturer's FDA label submission (SPL). They are provided for reference only and may contain errors or omissions. Always rely on the printed label itself and the official FDA labeling, and consult a pharmacist or healthcare professional with any questions about this product.