Cimerli Injection, Solution
Product Images NDC 70114-440

View Photos of Packaging, Regulatory Labels, and Product Appearance

Product Visual Gallery

This gallery contains 16 technical images submitted to the FDA as part of the official labeling for Cimerli (NDC 70114-440). Unlike standard consumer photos, these assets often include clinical data figures, molecular chemical structures, and official manufacturer packaging layouts.

As provided by Coherus Biosciences Inc, these visuals offer a comprehensive scientific overview of the product's physical and chemical identity, aiding pharmacists and researchers in product verification and study.

FDA Label Image

Image (Cimerli 01)

Image (Cimerli 01)
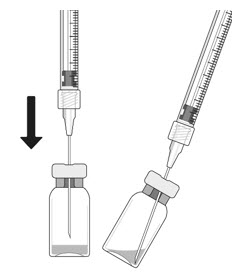
An instructional illustration showing two steps for withdrawing medication from a vial using a syringe. The first image depicts the syringe needle inserted vertically into the vial stopper with a downward arrow, and the second image shows the vial tilted at an angle with the needle inside.*
FDA Label Image

Image (Cimerli 02)

Image (Cimerli 02)
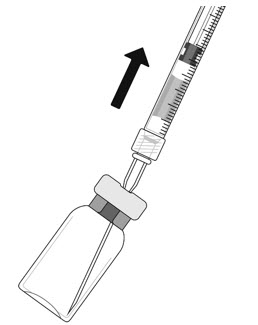
Illustration showing a vial being accessed with a syringe, extracting medication by drawing up solution from the vial through the stopper, indicated by an upward arrow.*
FDA Label Image

Image (Cimerli 03)

Image (Cimerli 03)
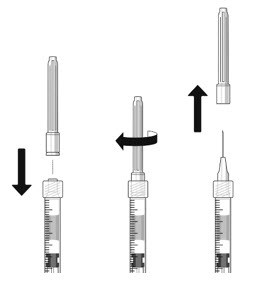
An instructional diagram showing the steps to prepare a syringe for injection. It depicts the removal of a cap by pulling downward, a twisting motion to unlock or secure the needle, and finally lifting off the needle cover, revealing the needle ready for use.*
FDA Label Image

Image (Cimerli 04)

Image (Cimerli 04)
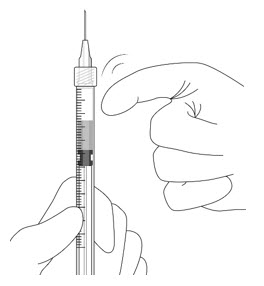
An instructional line drawing showing two hands holding a syringe. One hand grips the syringe barrel, while the other hand's thumb is positioned to flick or tap near the syringe plunger, indicating a step in preparing or using the injection.*
FDA Label Image

Image (Cimerli 05)

Image (Cimerli 05)
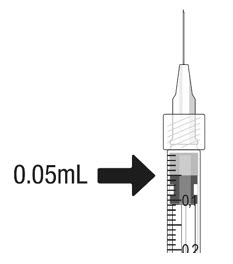
An illustration showing an intravitreal injection syringe partially filled to the 0.05 mL mark, indicating the volume intended for administration. The syringe has measurement markings and a needle attached.*
FDA Label Image

Figure 1 (Cimerli 06)

Figure 1 (Cimerli 06)
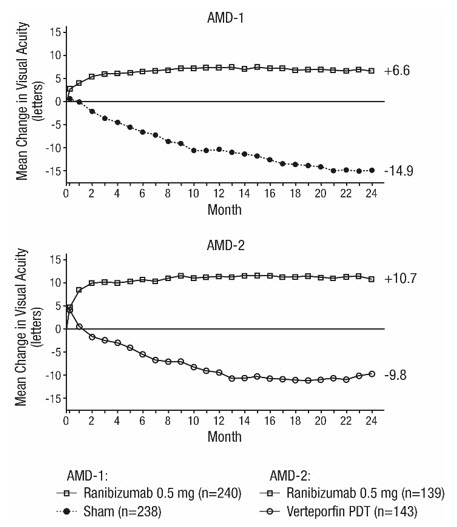
Two line graphs labeled AMD-1 and AMD-2 showing mean change in visual acuity (letters) over 24 months. The AMD-1 graph compares Ranibizumab 0.5 mg and Sham groups, with Ranibizumab showing an approximate +6.6 letter improvement and Sham a -14.9 letter decline. The AMD-2 graph compares Ranibizumab 0.5 mg and Verteporfin PDT, with Ranibizumab showing about +10.7 letter improvement and Verteporfin PDT a -9.8 letter decline.*
FDA Label Image

Figure 2 (Cimerli 07)

Figure 2 (Cimerli 07)
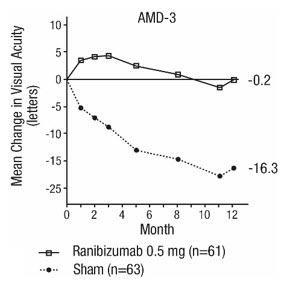
Line graph titled 'AMD-3' showing mean change in visual acuity (letters) over 12 months. It compares ranibizumab 0.5 mg (n=61) with sham treatment (n=63). The ranibizumab line remains near baseline, while the sham line shows a steady decline down to -16.3 letters.*
FDA Label Image

Figure 3 (Cimerli 08)

Figure 3 (Cimerli 08)
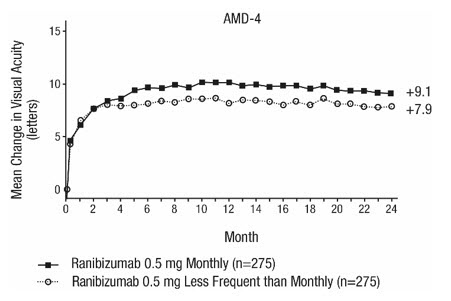
A line graph titled AMD-4 depicting mean change in visual acuity (letters) over 24 months. It compares two groups receiving ranibizumab 0.5 mg: one monthly and one less frequent than monthly. The monthly group starts with a rapid increase, reaching approximately +9.1 letters, while the less frequent group reaches about +7.9 letters at 24 months.*
FDA Label Image

Figure 4 (Cimerli 09)

Figure 4 (Cimerli 09)
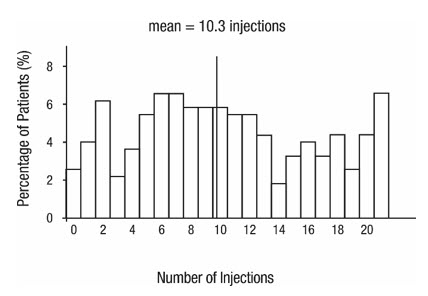
A bar chart depicting the percentage of patients receiving intravitreal injections over a range of injection counts from 0 to 21. The chart highlights a mean of 10.3 injections, with the y-axis representing the percentage of patients and the x-axis representing the number of injections.*
FDA Label Image

Figure 5 (Cimerli 10)

Figure 5 (Cimerli 10)
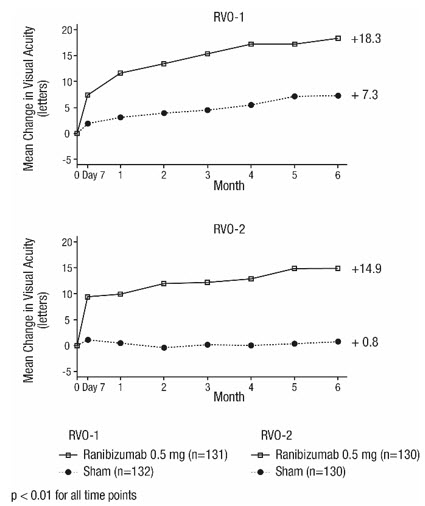
Two line graphs labeled RVO-1 and RVO-2 showing mean change in visual acuity (letters) over 6 months. Both graphs compare Ranibizumab 0.5 mg versus sham treatment. Ranibizumab groups show a steadily increasing improvement in visual acuity, reaching about +18 and +15 letters in RVO-1 and RVO-2 respectively, while sham groups show minimal change under +8 and +1 letter. Statistical significance (p < 0.01) is noted for all time points.*
FDA Label Image

Figure 6 (Cimerli 11)

Figure 6 (Cimerli 11)
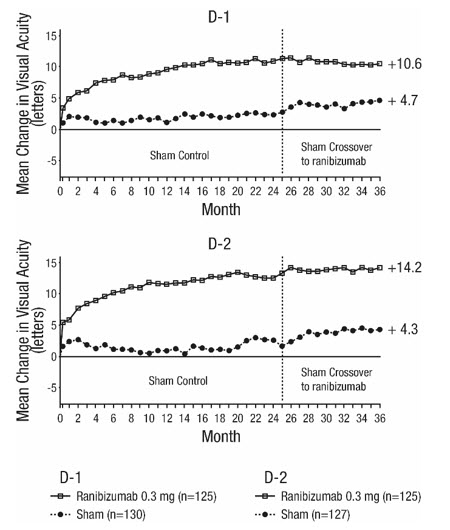
This image contains two line graphs labeled D-1 and D-2. Both graphs show mean change in visual acuity (letters) on the vertical axis over a 36-month period on the horizontal axis. They compare ranibizumab 0.3 mg injection versus sham control, with a crossover to ranibizumab occurring after month 24. The graphs track visual acuity improvement over time for two groups with sample sizes indicated.*
FDA Label Image

Figure 7 (Cimerli 12)

Figure 7 (Cimerli 12)
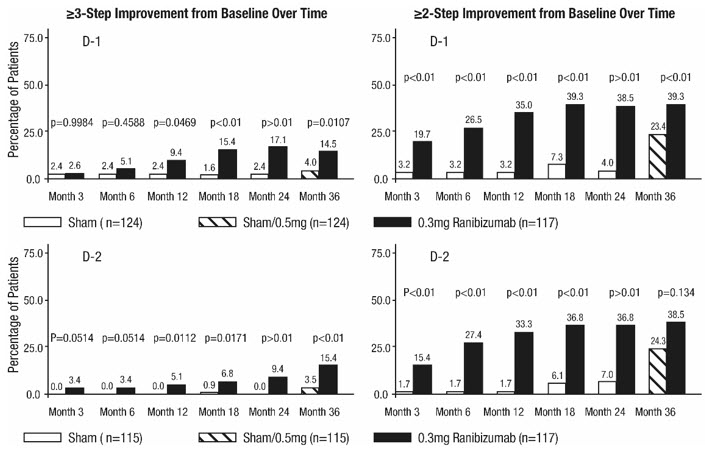
A multi-panel bar chart showing proportions of patients achieving ≥3-step and ≥2-step improvements from baseline over time for treatments involving sham, sham with 0.5 mg dose, and 0.3 mg ranibizumab injection groups. The chart compares percentage improvements at months 3, 6, 12, 18, 24, and 36, with statistical significance values (p-values) annotated above bars.*
FDA Label Image

Figure 8 (Cimerli 13)

Figure 8 (Cimerli 13)
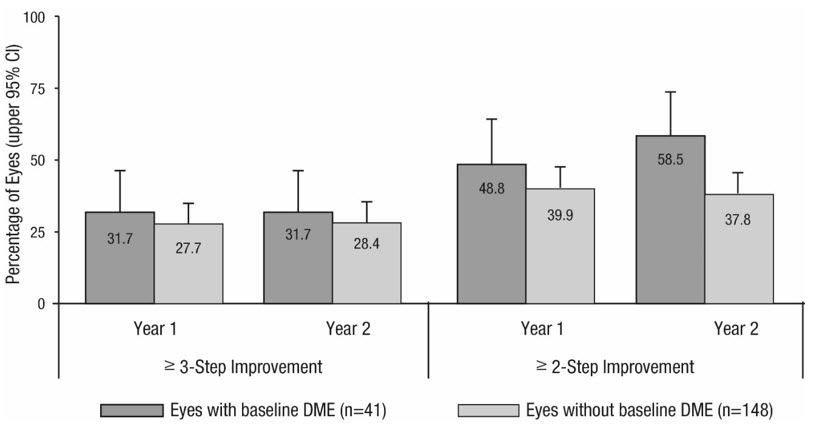
A bar chart comparing the percentage of eyes showing at least 3-step or 2-step improvement over Years 1 and 2, separated by eyes with baseline diabetic macular edema (DME) and without baseline DME. The vertical axis represents percentage of eyes, with error bars indicating upper 95% confidence intervals. Four groups are shown: Eyes with baseline DME and eyes without baseline DME for each improvement category over two years.*
FDA Label Image

Figure 9 (Cimerli 14)

Figure 9 (Cimerli 14)
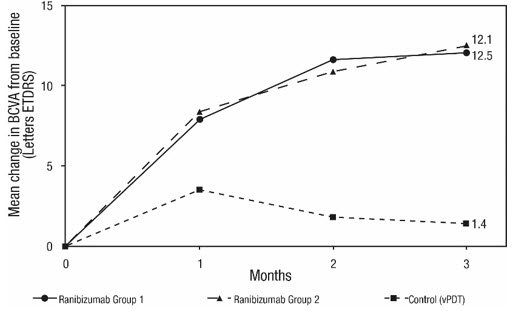
Line graph showing mean change in BCVA (letters ETDRS) from baseline over 3 months for three groups: Ranibizumab Group 1, Ranibizumab Group 2, and Control (vPDT). Both Ranibizumab groups show increasing improvement peaking around 12 letters, while the Control group shows minimal change.*
FDA Label Image

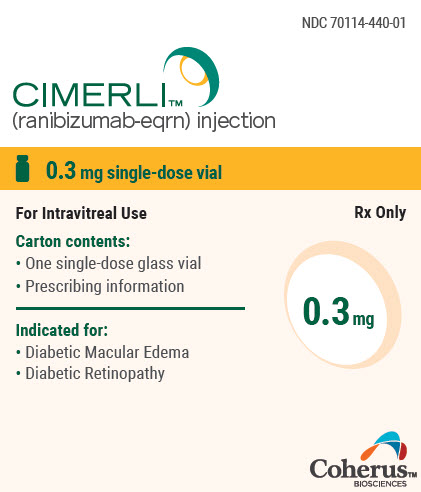
Principal Display Panel (0.3 mg Vial Carton)

Principal Display Panel (0.3 mg Vial Carton)
Label for CIMERLI (ranibizumab-eqrn) injection, 0.3 mg single-dose vial, intravitreal use. The carton includes one single-dose glass vial and prescribing information. The label lists indications for diabetic macular edema and diabetic retinopathy, and shows Coherus BioSciences Inc as the labeler with NDC 70114-440-01.*
FDA Label Image

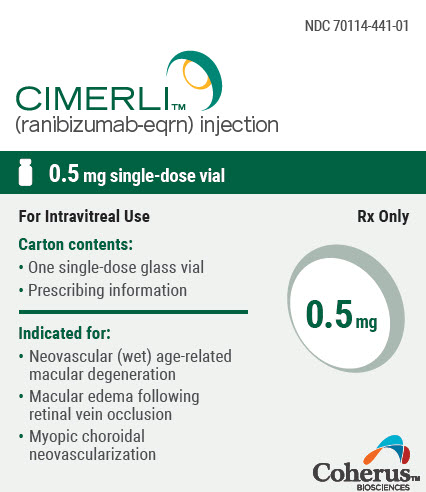
Principal Display Panel (0.5 mg Vial Carton)

Principal Display Panel (0.5 mg Vial Carton)
CIMERLI (ranibizumab-eqrn) injection 0.5 mg single-dose vial label. The vial contains 0.5 mg of ranibizumab-eqrn in a single-dose glass vial for intravitreal use. The label indicates use for neovascular (wet) age-related macular degeneration, macular edema following retinal vein occlusion, and myopic choroidal neovascularization. Marketed by Coherus BioSciences Inc.*

* About these descriptions: Image descriptions on this page are generated by automated AI analysis of the product label images from the manufacturer's FDA label submission (SPL). They are provided for reference only and may contain errors or omissions. Always rely on the printed label itself and the official FDA labeling, and consult a pharmacist or healthcare professional with any questions about this product.