Docetaxel Injection
Product Images NDC 70121-1222

17 FDA label images from Amneal Pharmaceuticals Llc · Packaging, Regulatory Labels, and Product Appearance

Product Visual Gallery

This gallery contains 17 technical images submitted to the FDA as part of the official labeling for Docetaxel (NDC 70121-1222). Unlike standard consumer photos, these assets often include clinical data figures, molecular chemical structures, and official manufacturer packaging layouts.

As provided by Amneal Pharmaceuticals Llc, these visuals offer a comprehensive scientific overview of the product's physical and chemical identity, aiding pharmacists and researchers in product verification and study.

FDA Label Image

1 (Docetaxel Injection 1)
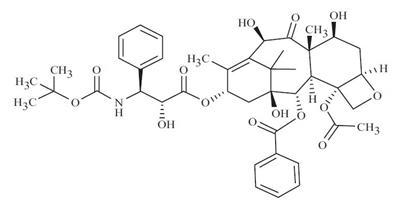
1 (Docetaxel Injection 1)
Chemical structure of Docetaxel displayed as a detailed molecular diagram showing its rings, functional groups, and stereochemistry.*
FDA Label Image

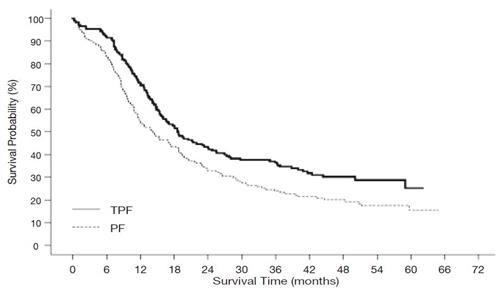
10 (Docetaxel Injection 10)

10 (Docetaxel Injection 10)
A survival probability curve chart comparing two treatments labeled TPF and PF over survival time in months. The y-axis shows survival probability (%) from 0 to 100%, and the x-axis shows survival time from 0 to 72 months. The chart displays that survival probability declines over time for both treatments, with TPF showing higher survival probability than PF throughout the timeline.*
FDA Label Image

11 (Docetaxel Injection 11)

11 (Docetaxel Injection 11)
A survival probability curve chart comparing two patient groups labeled TPF (n=255) and PF (n=246). The x-axis represents survival time in months, ranging from 0 to 72 months, and the y-axis shows survival probability as a percentage from 0% to 100%. Below the chart is a table indicating the number of patients at risk over time for each group.*
FDA Label Image

Kj (Docetaxel Injection 12)

Kj (Docetaxel Injection 12)
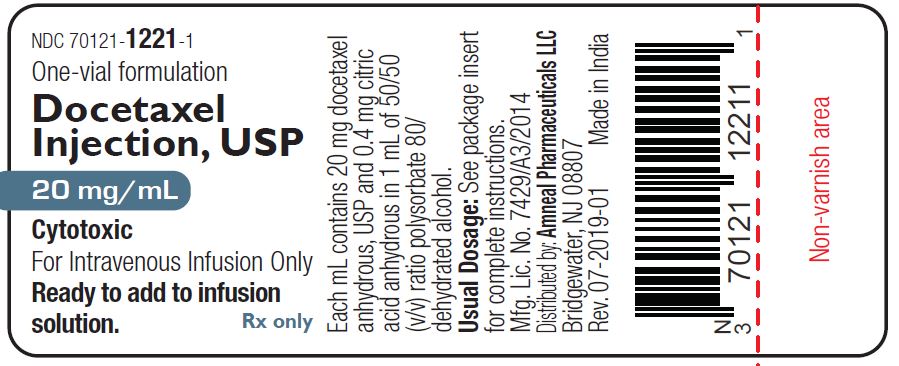
Label for Docetaxel Injection, USP 20 mg/mL, a cytotoxic intravenous infusion drug. The label states it is ready to add to infusion solution, distributed by Amneal Pharmaceuticals LLC, and made in India. It includes drug composition details and a barcode.*
FDA Label Image

We (Docetaxel Injection 13)

We (Docetaxel Injection 13)
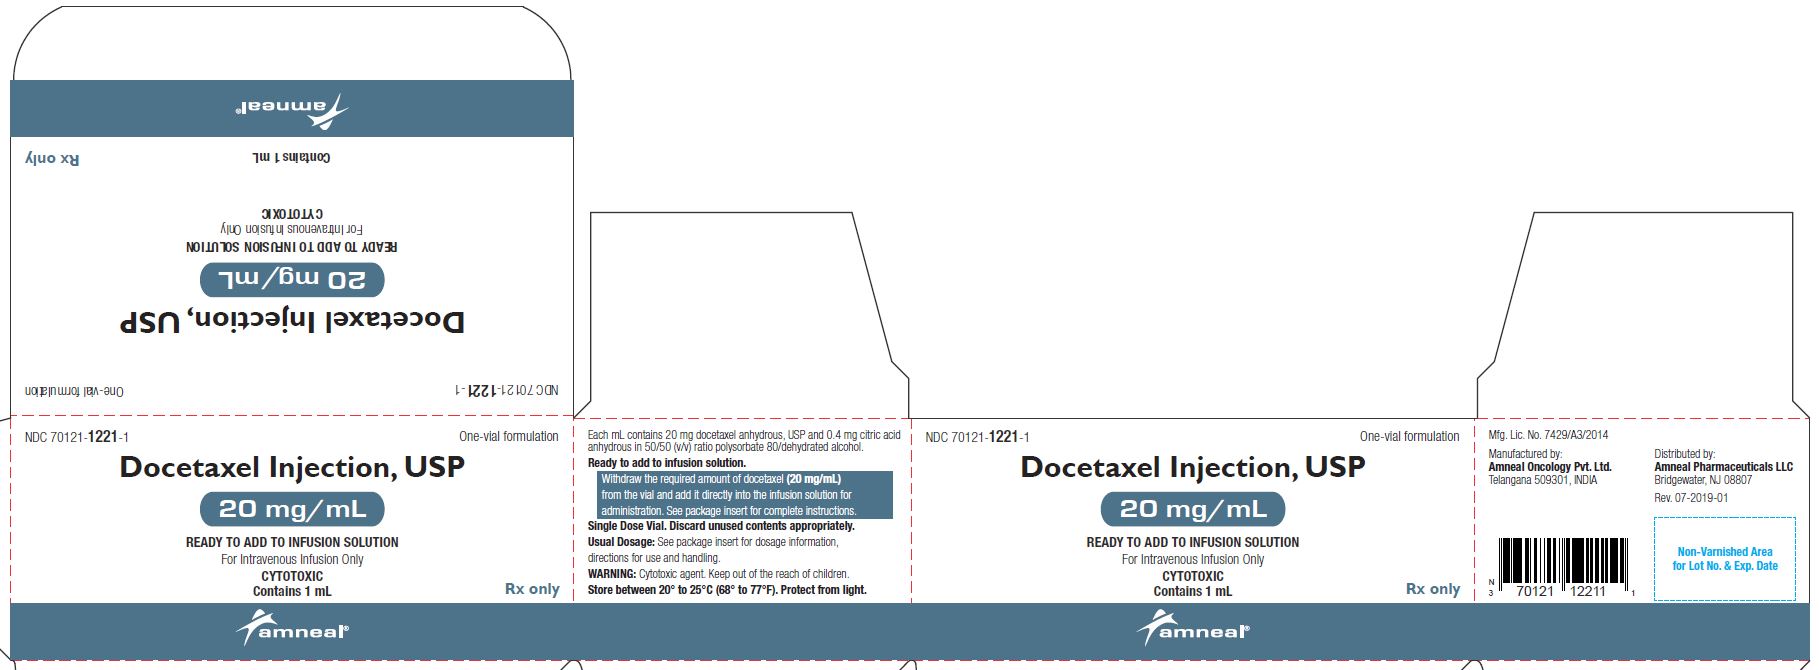
Label for Docetaxel Injection USP, 20 mg/mL, 1 mL vial by Amneal Pharmaceuticals LLC. The label states it is ready to add to infusion solution for intravenous use only and is cytotoxic. It includes directions for adding the product to infusion solution, dosage instructions, and storage conditions. Manufacturing details indicate Amneal Oncology Pvt. Ltd., India, with distribution by Amneal Pharmaceuticals LLC, Bridgewater, NJ.*
FDA Label Image

Po (Docetaxel Injection 14)

Po (Docetaxel Injection 14)
Label for Docetaxel Injection, USP 80 mg/4 mL (20 mg/mL) by Amneal Pharmaceuticals LLC. The label states it is a cytotoxic intravenous injection, ready to add to infusion solution, and for prescription use only. It includes dosage and formulation details along with manufacturing and distribution information.*
FDA Label Image

Fg (Docetaxel Injection 15)

Fg (Docetaxel Injection 15)
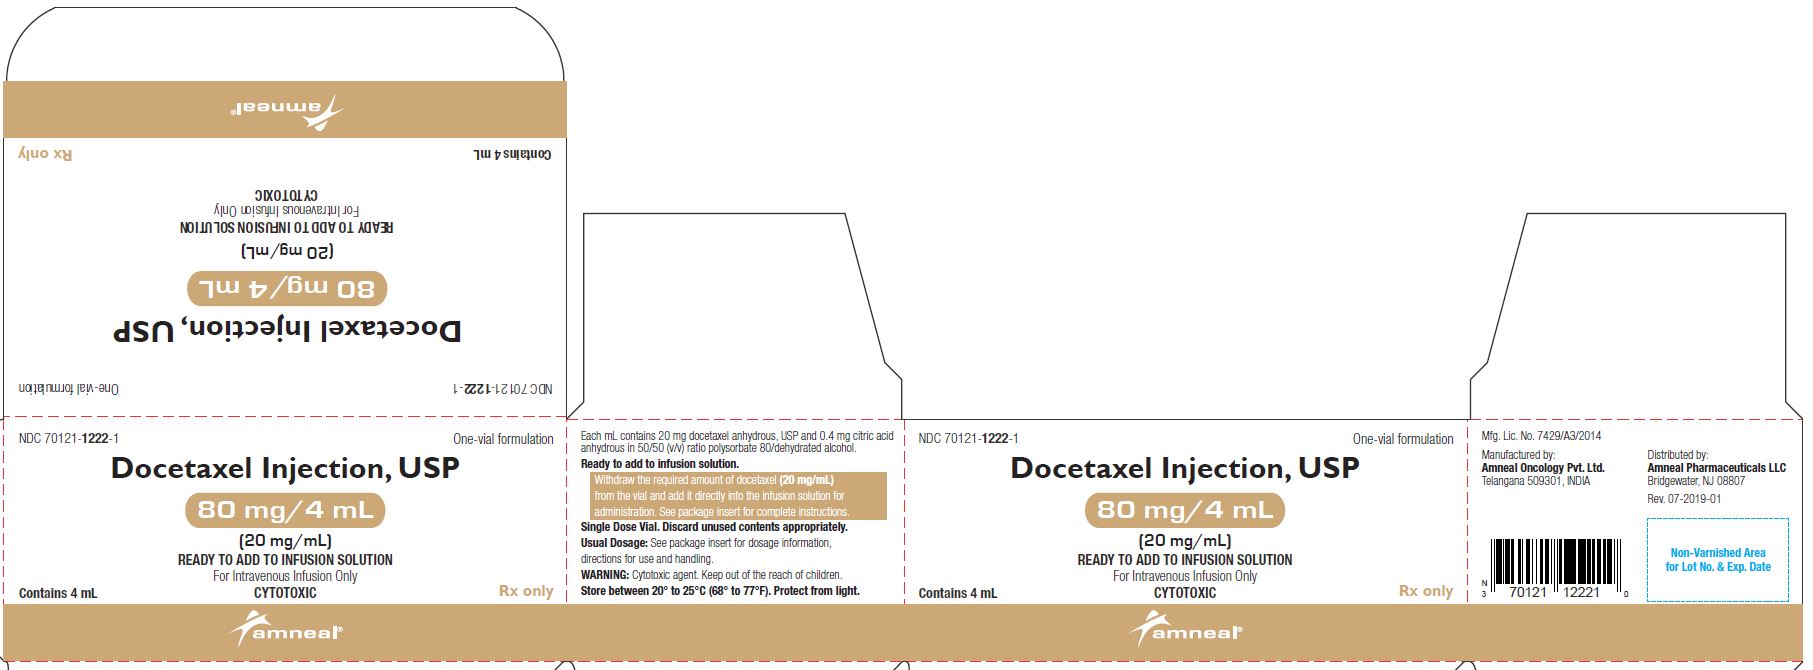
Packaging label for Docetaxel Injection, USP 80 mg/4 mL (20 mg/mL) intravenous injection by Amneal Pharmaceuticals LLC. The label states it is a ready-to-add-to-infusion solution, cytotoxic, single-dose vial, contains 4 mL, and is for intravenous infusion only. It includes dosage instructions, warnings, and storage conditions. Manufactured by Amneal Oncology Pvt. Ltd., India, and distributed by Amneal Pharmaceuticals LLC, Bridgewater, NJ.*
FDA Label Image

Fs (Docetaxel Injection 16)

Fs (Docetaxel Injection 16)
Label for Docetaxel Injection, USP, 160 mg/8 mL (20 mg/mL) from Amneal Pharmaceuticals LLC. The label states it is a one-vial formulation for intravenous infusion only, cytotoxic, and ready to add to infusion solution. It includes dosage information, manufacturer details, and a barcode.*
FDA Label Image

Uy (Docetaxel Injection 17)

Uy (Docetaxel Injection 17)
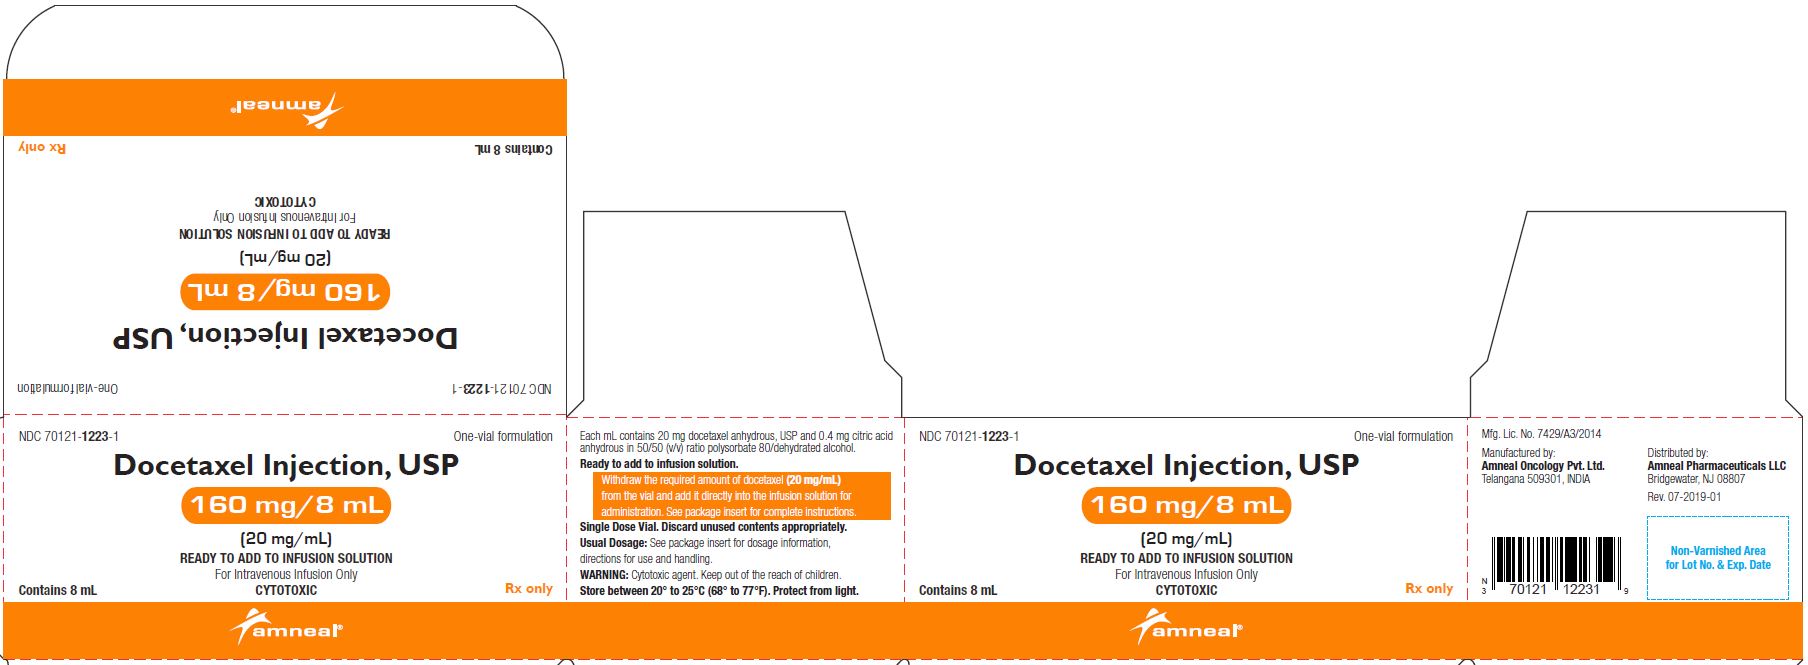
Packaging label for Docetaxel Injection, USP 160 mg/8 mL (20 mg/mL) intravenous injection by Amneal Pharmaceuticals LLC. The label indicates the product is ready to add to infusion solution, for intravenous infusion only, and cytotoxic. It includes dosage information, storage instructions (20° to 25°C), and warnings. The product is manufactured by Amneal Oncology Pvt. Ltd. and distributed by Amneal Pharmaceuticals LLC.*
FDA Label Image

2 (Docetaxel Injection 2)

2 (Docetaxel Injection 2)
A line graph showing disease-free survival (DFS) probability over time in months, comparing two groups labeled TAC and FAC. The y-axis represents DFS probability percentage, and the x-axis shows disease-free survival time in months up to 66 months.*
FDA Label Image

3 (Docetaxel Injection 3)

3 (Docetaxel Injection 3)
A Kaplan-Meier survival curve graph showing survival probability (%) on the y-axis and survival time in months on the x-axis. Two curves are compared: one labeled TAC and the other labeled FAC, depicting survival probabilities over time up to about 70 months.*
FDA Label Image

4 (Docetaxel Injection 4)

4 (Docetaxel Injection 4)
A Kaplan-Meier survival curve chart depicting cumulative probability over survival time in months. Two groups are compared: T75 (solid line) and BSC (dashed line), showing overall survival differences with a reported log-rank p-value of 0.010.*
FDA Label Image

5 (Docetaxel Injection 5)

5 (Docetaxel Injection 5)
A survival curve chart depicting cumulative probability versus survival time in months. Two curves labeled T75 and V/I show survival trends over approximately 21 months. The chart includes a statistical note with a log-rank p-value of 0.13, indicating overall survival comparison between two groups.*
FDA Label Image

6 (Docetaxel Injection 6)

6 (Docetaxel Injection 6)
A survival curve chart depicting survival probability over time in months. The chart compares two groups labeled T75 q3w and M q3w, with survival probability decreasing from near 1.0 to approximately 0.2-0.4 as survival time progresses to 30 months.*
FDA Label Image

7 (Docetaxel Injection 7)

7 (Docetaxel Injection 7)
A survival curve chart showing probability (%) over time (months) for two groups labeled TCF and CF. The y-axis represents probability from 0 to 100%, and the x-axis shows time in months from 0 to 24. Two descending stepwise curves illustrate decreasing probability over time for both groups.*
FDA Label Image

8 (Docetaxel Injection 8)

8 (Docetaxel Injection 8)
A survival probability curve chart depicting two groups labeled TCF and CF. The vertical axis represents survival probability (%) from 0 to 100%, while the horizontal axis shows survival time in months from 0 to 36. Both curves show decreasing survival probabilities over time, with the CF group generally having slightly higher survival rates than TCF.*
FDA Label Image

9 (Docetaxel Injection 9)

9 (Docetaxel Injection 9)
A line graph showing Progression Free Survival (PFS) Probability (%) over time in months up to 42 months. The graph compares two groups labeled TPF and PF, with PFS probability decreasing in both groups over time. The solid line represents TPF and the dashed line represents PF.*

* About these descriptions: Image descriptions on this page are generated by automated AI analysis of the product label images from the manufacturer's FDA label submission (SPL). They are provided for reference only and may contain errors or omissions. Always rely on the printed label itself and the official FDA labeling, and consult a pharmacist or healthcare professional with any questions about this product.