Boruzu Injection
Product Images NDC 70121-2484

View Photos of Packaging, Regulatory Labels, and Product Appearance

Product Visual Gallery

This gallery contains 11 technical images submitted to the FDA as part of the official labeling for Boruzu (NDC 70121-2484). Unlike standard consumer photos, these assets often include clinical data figures, molecular chemical structures, and official manufacturer packaging layouts.

As provided by Amneal Pharmaceuticals Llc, these visuals offer a comprehensive scientific overview of the product's physical and chemical identity, aiding pharmacists and researchers in product verification and study.

FDA Label Image

1 (Boruzu Bortezomib Injection 1)
1 (Boruzu Bortezomib Injection 1)
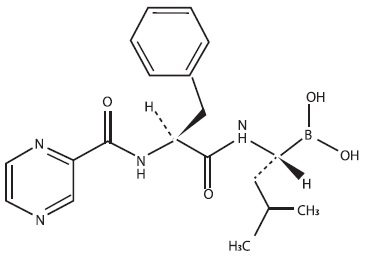
Chemical structure diagram of bortezomib, the active ingredient in BORUZU injection. The illustration shows the molecular arrangement including rings and functional groups characteristic of bortezomib.*
FDA Label Image

1 (Boruzu Bortezomib Injection 10)

1 (Boruzu Bortezomib Injection 10)
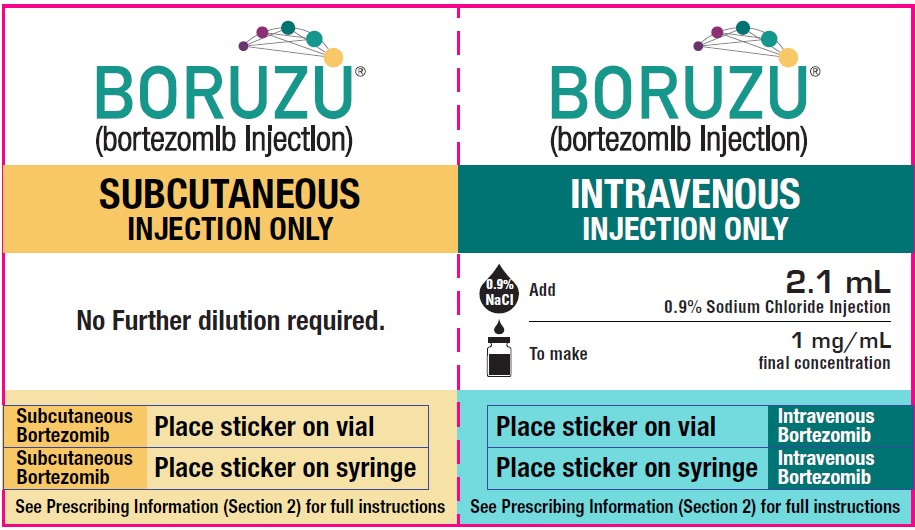
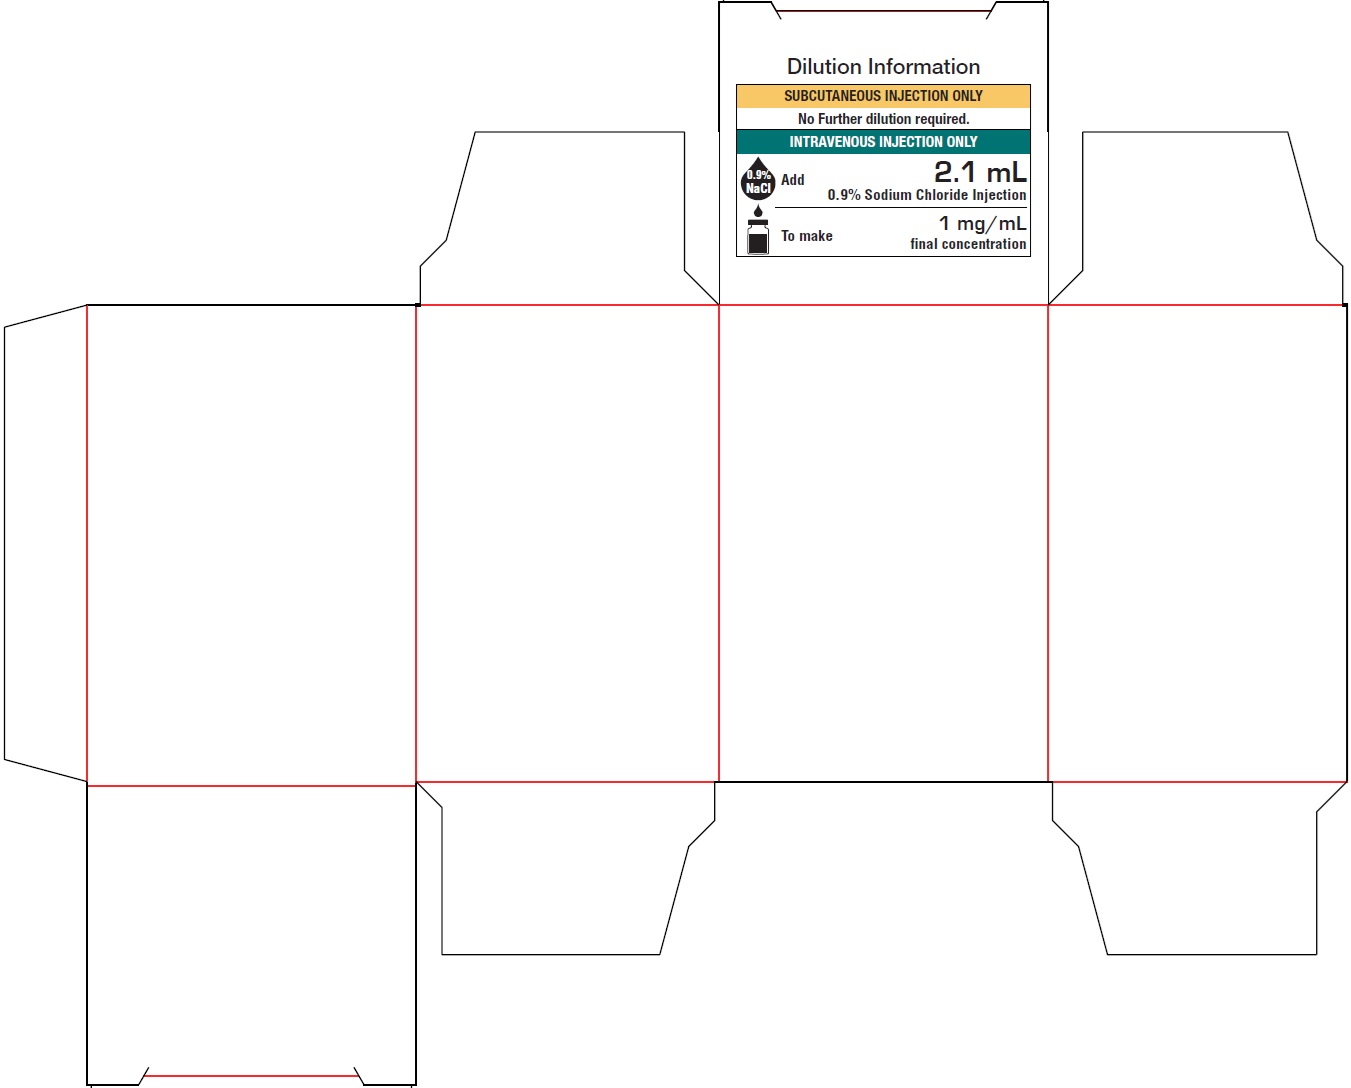
Packaging label for BORUZU injection, a human prescription drug containing bortezomib. The label includes dilution information specifying no further dilution for subcutaneous injection and instructions to add 2.1 mL of 0.9% sodium chloride injection for intravenous use to achieve a final concentration of 1 mg/mL. Labeler is Amneal Pharmaceuticals LLC.*
FDA Label Image

1 (Boruzu Bortezomib Injection 11)

1 (Boruzu Bortezomib Injection 11)
A dual instructional label for BORUZU (bortezomib injection) indicating separate preparation guidelines for subcutaneous and intravenous injections. The subcutaneous section notes no further dilution is required and to place stickers on the vial and syringe. The intravenous section instructs adding 2.1 mL of 0.9% sodium chloride to achieve a 1 mg/mL concentration, with similar sticker placement instructions. Both sections reference full instructions in the prescribing information.*
FDA Label Image

1 (Boruzu Bortezomib Injection 2)

1 (Boruzu Bortezomib Injection 2)
A Kaplan-Meier survival curve chart showing the percentage of patients over time in months for two treatment groups labeled B-MP and MP. The vertical axis represents the percentage of patients, starting at 100%, while the horizontal axis shows time in months up to 26 months. The chart includes a table listing the number of patients at risk for each group at different time points. A p-value from a log-rank test is indicated on the chart, demonstrating a statistical comparison between the two groups.*
FDA Label Image

1 (Boruzu Bortezomib Injection 3)

1 (Boruzu Bortezomib Injection 3)
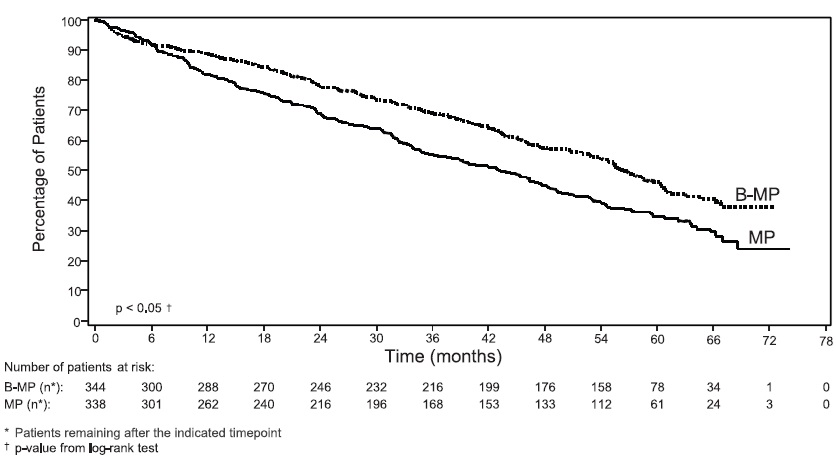
A Kaplan-Meier survival curve comparing the percentage of patients over time (months) between two groups: B-MP and MP. The y-axis shows the percentage of patients, while the x-axis shows time in months up to approximately 72. The graph includes a table beneath showing the number of patients at risk at various time points for each group and indicates a statistical significance with p < 0.05 from a log-rank test.*
FDA Label Image

1 (Boruzu Bortezomib Injection 4)

1 (Boruzu Bortezomib Injection 4)
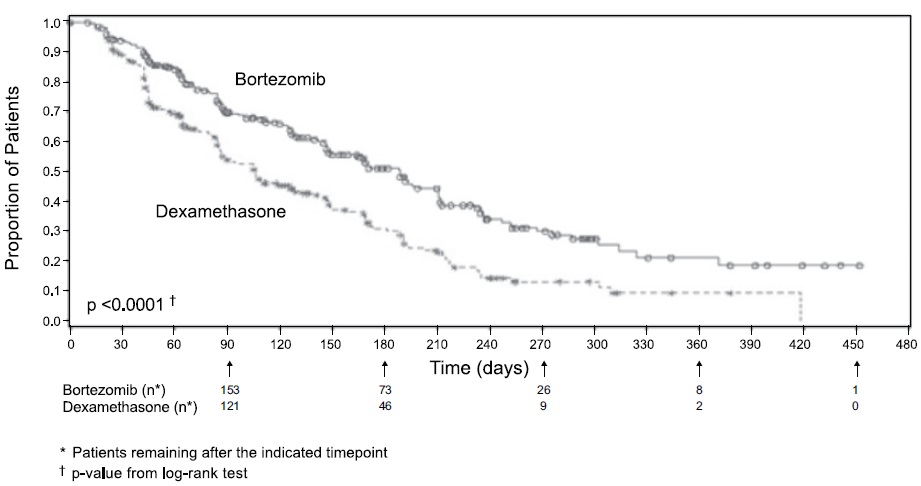
A Kaplan-Meier survival curve comparing the proportion of patients over time (days) treated with Bortezomib versus Dexamethasone. The graph shows patient survival proportions on the y-axis and time in days on the x-axis, with patient counts remaining at specified intervals. Bortezomib is represented with higher survival proportions over the study period.*
FDA Label Image

1 (Boruzu Bortezomib Injection 5)

1 (Boruzu Bortezomib Injection 5)
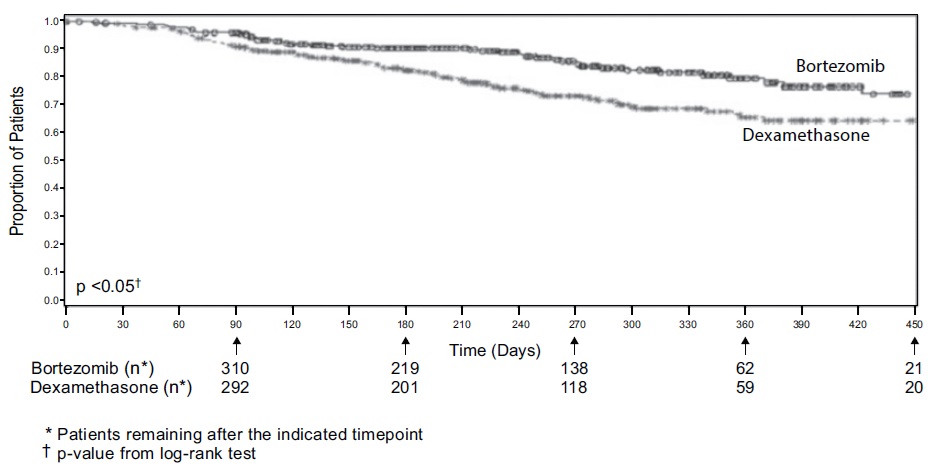
Kaplan-Meier survival curve showing the proportion of patients over time (days) for treatments with Bortezomib and Dexamethasone. The graph includes patient counts at multiple time points and indicates a statistically significant difference (p < 0.05) based on a log-rank test.*
FDA Label Image

1 (Boruzu Bortezomib Injection 6)

1 (Boruzu Bortezomib Injection 6)
A Kaplan-Meier survival curve chart comparing the percentage of patients over time (in months) for two treatments labeled BR-CAP and R-CHOP. The chart includes a log rank test p-value less than 0.001 and a risk table below showing numbers of subjects at risk for each treatment at specified time points.*
FDA Label Image

1 (Boruzu Bortezomib Injection 7)

1 (Boruzu Bortezomib Injection 7)
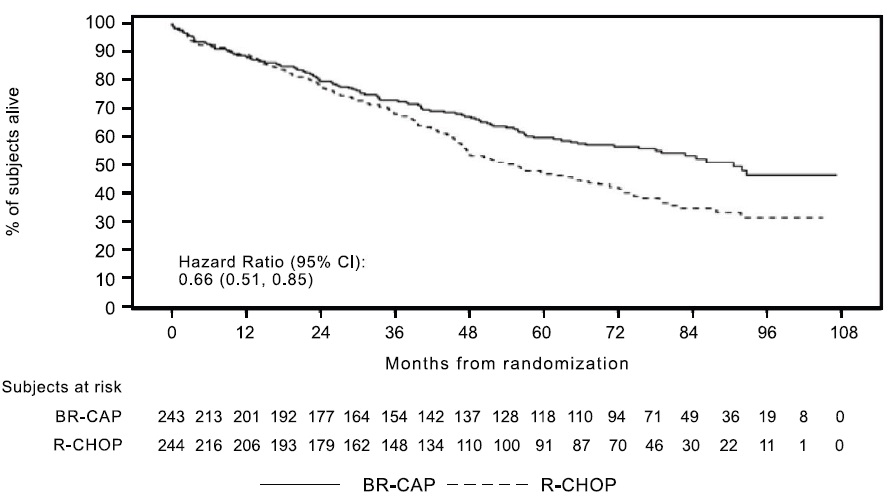
A survival curve chart showing percentage of subjects alive over months from randomization for two treatment groups: BR-CAP (solid line) and R-CHOP (dashed line). The x-axis represents months from randomization up to 108 months, and the y-axis shows the percentage of subjects alive. The chart includes a hazard ratio of 0.66 with 95% confidence interval (0.51, 0.85) and a table of subjects at risk for both groups at various time points.*
FDA Label Image

1 (Boruzu Bortezomib Injection 8)

1 (Boruzu Bortezomib Injection 8)
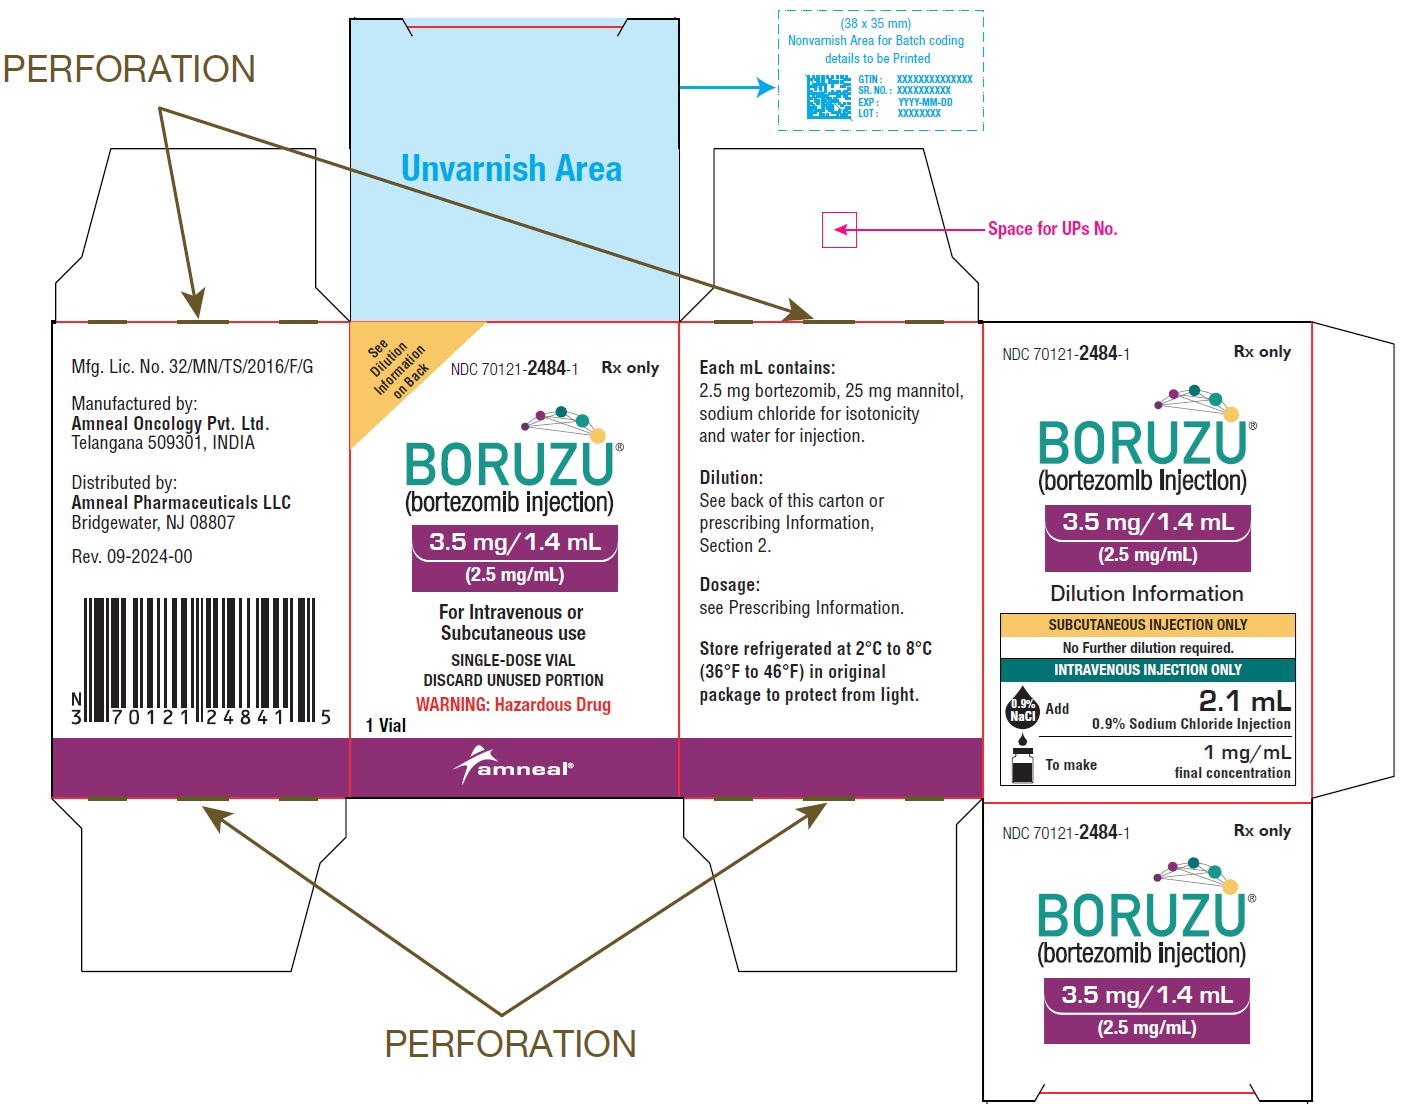
Label for BORUZU (bortezomib injection) 3.5 mg/1.4 mL (2.5 mg/mL) single-dose vial by Amneal Pharmaceuticals LLC. It specifies use for intravenous or subcutaneous injection, contains warnings about hazardous drug status, storage instructions at 2°C to 8°C, and manufacturer details from Amneal Oncology Pvt. Ltd., India. The label also includes a barcode and NDC 70121-2484-1.*
FDA Label Image

1 (Boruzu Bortezomib Injection 9)

1 (Boruzu Bortezomib Injection 9)
Label for BORUZU (bortezomib injection) 3.5 mg/1.4 mL (2.5 mg/mL) single-dose vial by Amneal Pharmaceuticals LLC. The label includes dilution instructions for subcutaneous and intravenous use, storage conditions, and warnings. Manufactured by Amneal Oncology Pvt. Ltd., India. NDC 70121-2484-1 with barcode and regulatory information.*

* About these descriptions: Image descriptions on this page are generated by automated AI analysis of the product label images from the manufacturer's FDA label submission (SPL). They are provided for reference only and may contain errors or omissions. Always rely on the printed label itself and the official FDA labeling, and consult a pharmacist or healthcare professional with any questions about this product.