Zontivity
Product Images NDC 70347-208

View Photos of Packaging, Regulatory Labels, and Product Appearance

Product Visual Gallery

This gallery contains 8 technical images submitted to the FDA as part of the official labeling for Zontivity (NDC 70347-208). Unlike standard consumer photos, these assets often include clinical data figures, molecular chemical structures, and official manufacturer packaging layouts.

As provided by Aralez Pharmaceuticals Us Inc., these visuals offer a comprehensive scientific overview of the product's physical and chemical identity, aiding pharmacists and researchers in product verification and study.

FDA Label Image

Figure 1 (Zontivity 01)
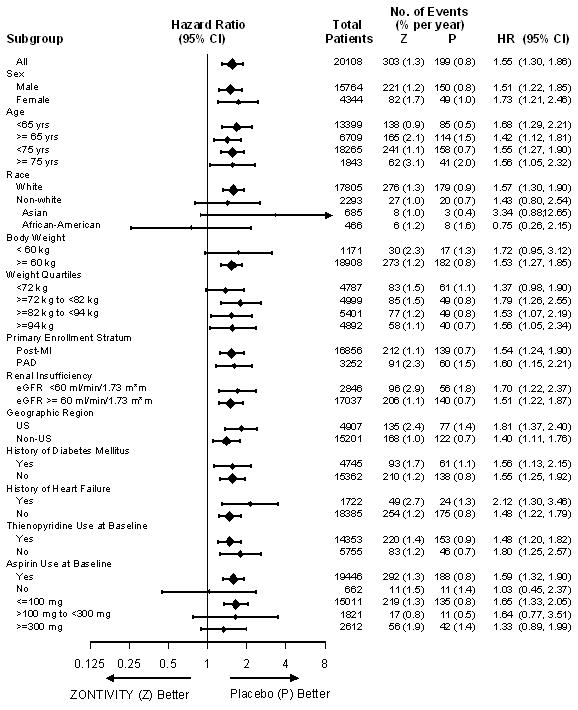
Figure 1 (Zontivity 01)
A forest plot chart showing hazard ratios with 95% confidence intervals for various subgroups of patients treated with ZONTIVITY compared to placebo. The chart includes data columns for subgroup, hazard ratio with confidence intervals, total patients, number and percentage of events per year, p-values, and hazard ratios, illustrating comparative outcomes across categories such as sex, age, race, body weight, medical history, and geographic region.*
FDA Label Image

Chemical Structure (Zontivity 02)

Chemical Structure (Zontivity 02)
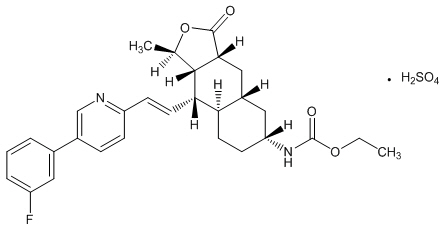
Chemical structure diagram of the active ingredient in ZONTIVITY, showing molecular bonds including a fluorophenyl group, pyridine ring, and multiple chiral centers, with a sulfuric acid association indicated as H2SO4.*
FDA Label Image

Figure 2 (Zontivity 03)

Figure 2 (Zontivity 03)
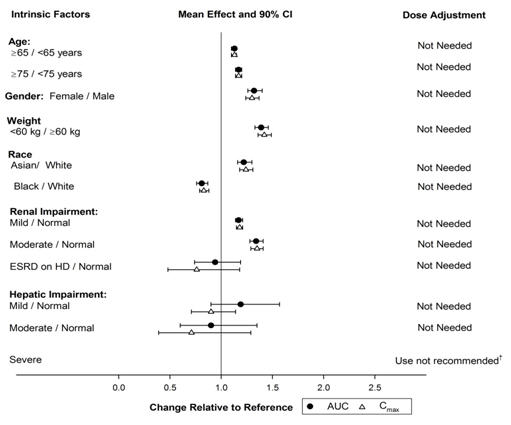
A forest plot chart titled "Intrinsic Factors" showing mean effect and 90% confidence intervals for various demographic and clinical factors such as age, gender, weight, race, renal impairment, and hepatic impairment on pharmacokinetic measures (AUC and Cmax) relative to a reference. The chart also includes dose adjustment recommendations, mostly indicating "Not Needed," except for severe hepatic impairment, stating "Use not recommended." The data points depict variability in drug exposure across subgroups.*
FDA Label Image

Figure 3 (Zontivity 04)

Figure 3 (Zontivity 04)
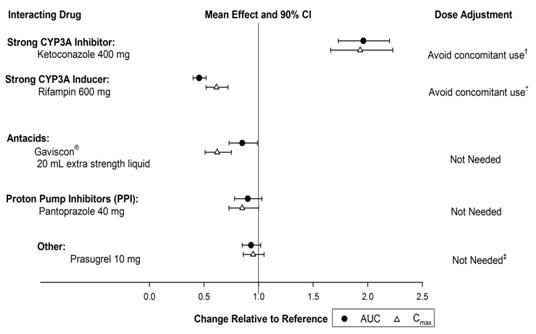
A chart depicting the mean effect and 90% confidence interval on pharmacokinetic parameters (AUC and Cmax) relative to a reference for the drug ZONTIVITY when administered with various interacting drugs, including strong CYP3A inhibitors ketoconazole 400 mg and ritonavir 600 mg, the antacid Gaviscon, proton pump inhibitor pantoprazole 40 mg, and prasugrel 10 mg. The chart indicates dose adjustment recommendations for each interaction.*
FDA Label Image

Figure 4 (Zontivity 05)

Figure 4 (Zontivity 05)
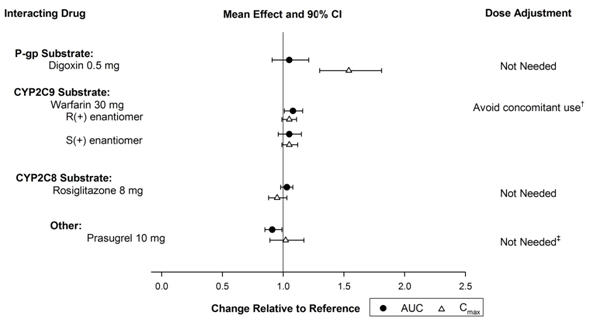
A chart showing the mean effect and 90% confidence intervals for various interacting drugs with ZONTIVITY, including digoxin, warfarin (R+ and S+ enantiomers), rosiglitazone, and prasugrel. It displays changes relative to reference in AUC and Cmax, with corresponding dose adjustment recommendations for each drug.*
FDA Label Image

Figure 5 (Zontivity 06)

Figure 5 (Zontivity 06)
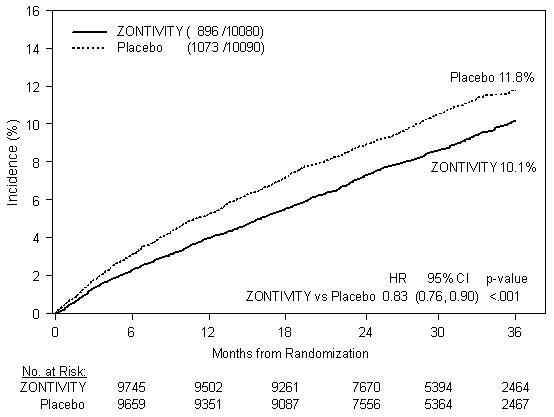
A line graph depicting the incidence percentage over 36 months from randomization comparing ZONTIVITY and placebo groups. The graph shows lower incidence for the ZONTIVITY group than placebo, with numerical data for number at risk at various months provided for both groups. Hazard ratio and confidence intervals are indicated for ZONTIVITY versus placebo.*
FDA Label Image

Figure 6 (Zontivity 07)

Figure 6 (Zontivity 07)
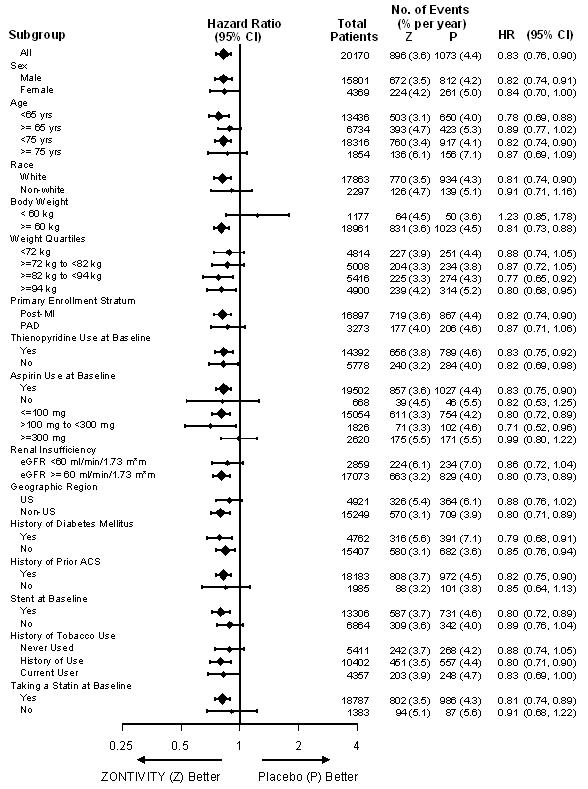
A forest plot chart showing hazard ratios with 95% confidence intervals for various subgroups comparing ZONTIVITY versus placebo. Subgroups include sex, age, race, body weight, primary enrollment stratum, baseline medication use, renal insufficiency, geographic region, history of diabetes, prior acute coronary syndrome, stent use, tobacco use, and statin use at baseline. The chart visually presents each subgroup's hazard ratio distribution and event counts, indicating comparative risk outcomes.*
FDA Label Image

Principal Display Panel (30 Tablet Bottle Label)

Principal Display Panel (30 Tablet Bottle Label)
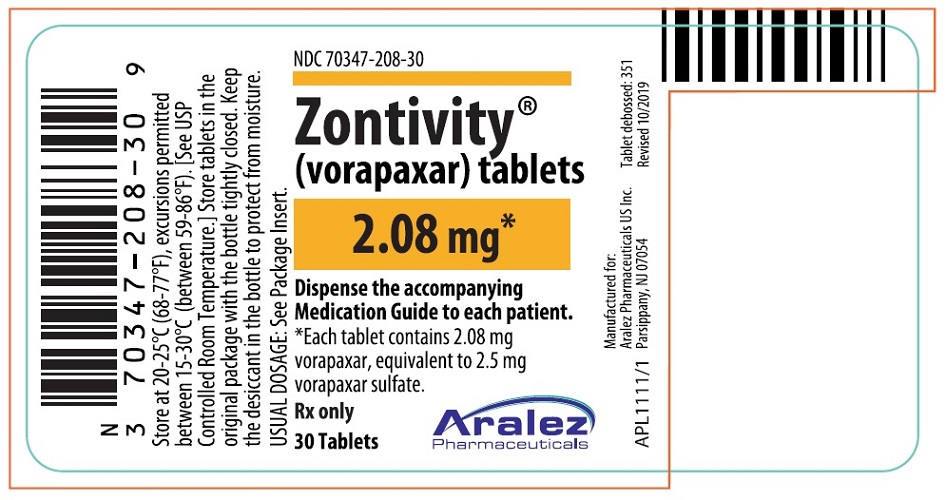
Label for Zontivity (vorapaxar) tablets, 2.08 mg strength, containing 30 tablets. The label includes storage instructions, a barcode, NDC number 70347-208-30, and manufacturer information for Aralez Pharmaceuticals US Inc. It advises dispensing the accompanying Medication Guide.*

* About these descriptions: Image descriptions on this page are generated by automated AI analysis of the product label images from the manufacturer's FDA label submission (SPL). They are provided for reference only and may contain errors or omissions. Always rely on the printed label itself and the official FDA labeling, and consult a pharmacist or healthcare professional with any questions about this product.