Sacubitril And Valsartan Tablet, Film Coated
Product Images NDC 70377-031

View Photos of Packaging, Regulatory Labels, and Product Appearance

Product Visual Gallery

This gallery contains 17 technical images submitted to the FDA as part of the official labeling for Sacubitril And Valsartan (NDC 70377-031). Unlike standard consumer photos, these assets often include clinical data figures, molecular chemical structures, and official manufacturer packaging layouts.

As provided by Biocon Pharma Inc., these visuals offer a comprehensive scientific overview of the product's physical and chemical identity, aiding pharmacists and researchers in product verification and study.

FDA Label Image

Sacubitril And Valsartan Tablets 24 mg/26 mg, 500's Tablets (24 26mg 500s)
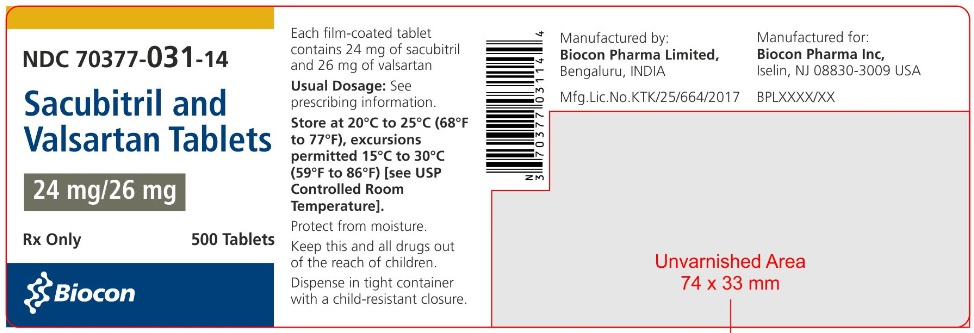
Sacubitril And Valsartan Tablets 24 mg/26 mg, 500's Tablets (24 26mg 500s)
Packaging label for Sacubitril and Valsartan Tablets, 24 mg/26 mg, film-coated oral tablets. The label indicates 500 tablets per container and is labeled for Biocon Pharma Inc. Manufactured by Biocon Pharma Limited, Bengaluru, India. Dosage and storage instructions are provided along with a barcode and regulatory information.*
FDA Label Image

Sacubitril And Valsartan Tablets 24 mg/26 mg, 60's Tablets (24 26mg 60s)

Sacubitril And Valsartan Tablets 24 mg/26 mg, 60's Tablets (24 26mg 60s)
Label for Sacubitril and Valsartan Tablets 24 mg/26 mg film-coated tablets. The label states the product is Rx Only with a quantity of 60 tablets. It includes manufacturer information for Biocon Pharma Limited, Bengaluru, India, and Biocon Pharma Inc, Iselin, NJ, USA. Storage instructions and dosage reference are also visible on the label.*
FDA Label Image

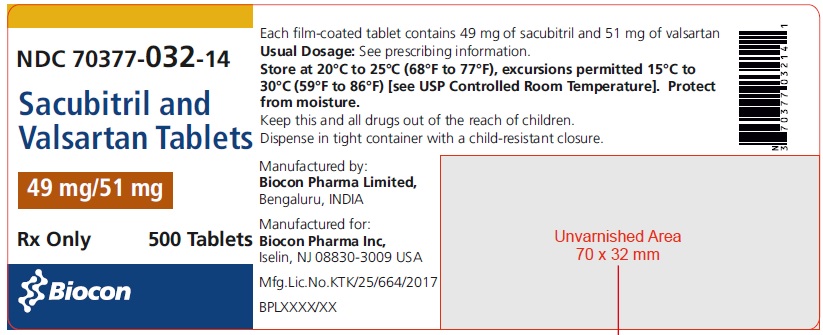
Sacubitril And Valsartan Tablets 49 mg/51 mg, 500's Tablets (49 51 500s)

Sacubitril And Valsartan Tablets 49 mg/51 mg, 500's Tablets (49 51 500s)
Label for Sacubitril and Valsartan Tablets 49 mg/51 mg film-coated tablets by Biocon Pharma Inc. The label indicates a package of 500 tablets. It includes storage instructions, dosage formulation details, manufacturing location in Bengaluru, India, and the labeler in Iselin, NJ, USA. The label also features the Biocon logo and NDC 70377-032-14.*
FDA Label Image

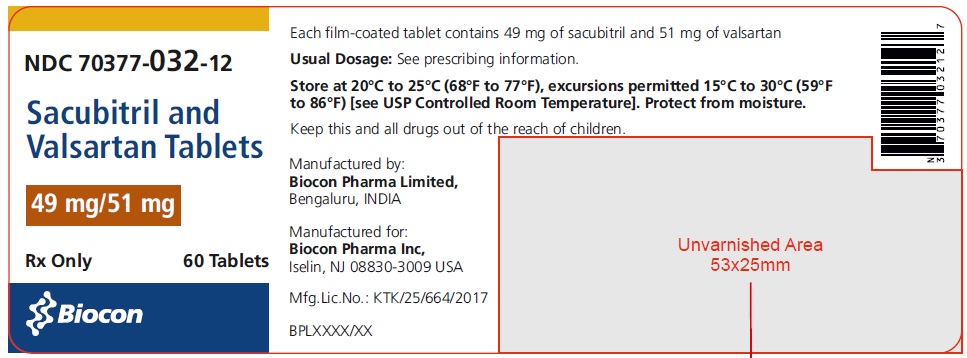
Sacubitril And Valsartan Tablets 49 mg/51 mg, 60's Tablets (49 51 60s)

Sacubitril And Valsartan Tablets 49 mg/51 mg, 60's Tablets (49 51 60s)
Label for Sacubitril and Valsartan Tablets 49 mg/51 mg film-coated tablets. The label states the product is Rx only, contains 60 tablets, and is manufactured by Biocon Pharma Limited, Bengaluru, India, for Biocon Pharma Inc., Iselin, NJ, USA. It includes storage instructions and a barcode.*
FDA Label Image

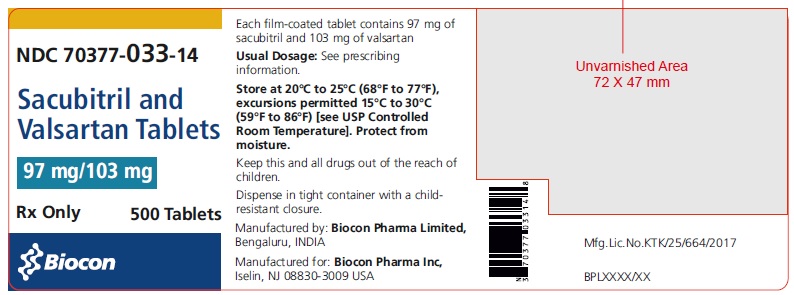
Sacubitril And Valsartan Tablets 97 mg/103 mg, 500's Tablets (97 103mg 500s)

Sacubitril And Valsartan Tablets 97 mg/103 mg, 500's Tablets (97 103mg 500s)
Label for Sacubitril and Valsartan Tablets 97 mg/103 mg film-coated tablets. The package contains 500 tablets and is labeled Rx Only. Manufactured by Biocon Pharma Limited, Bengaluru, India, for Biocon Pharma Inc., Iselin, NJ. Storage instructions include keeping at 20°C to 25°C with excursions permitted to 15°C to 30°C, protecting from moisture, and using a child-resistant container.*
FDA Label Image

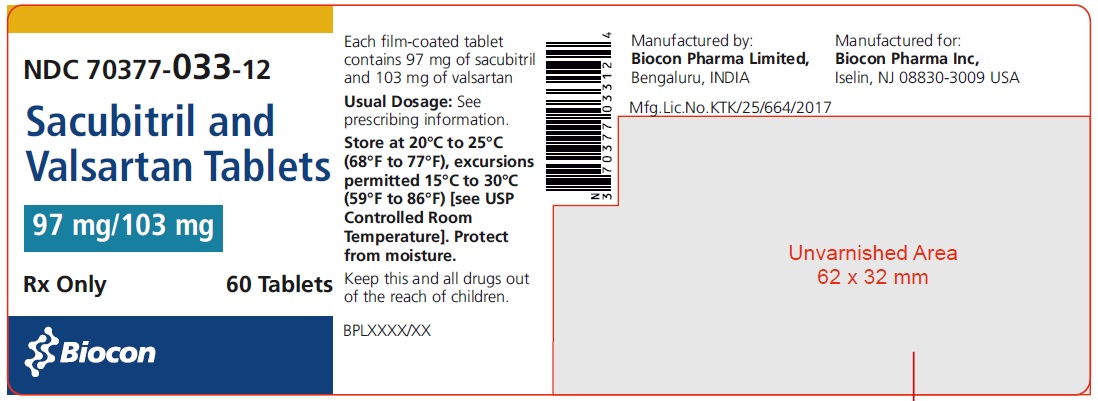
Sacubitril And Valsartan Tablets 97 mg/103 mg, 60's Tablets (97 103mg 60s)

Sacubitril And Valsartan Tablets 97 mg/103 mg, 60's Tablets (97 103mg 60s)
Sacubitril and Valsartan Tablets 97 mg/103 mg film-coated tablets package label showing a 60-tablet count. The label includes storage instructions, a barcode, and manufacturing information from Biocon Pharma Limited, Bengaluru, India, and Biocon Pharma Inc., Iselin, NJ. The label is marked for prescription use only and features the Biocon logo.*
FDA Label Image

Figure 1: Effect Of Sacubitril And Valsartan Tablets On Pharmacokinetics Of Coadministered Drugs (Figure 1)

Figure 1: Effect Of Sacubitril And Valsartan Tablets On Pharmacokinetics Of Coadministered Drugs (Figure 1)
A chart showing the geometric mean ratio and 90% confidence intervals for coadministered drugs relative to a reference. It displays data for drugs including Furosemide, Warfarin, Digoxin, Carvedilol, Levonorgestrel, Ethinyl estradiol, Amlodipine, HCTZ, Metformin, Atorvastatin, and Sildenafil. Data points for AUC and Cmax are represented with filled and open circles, respectively, along the horizontal axis indicating change relative to reference.*
FDA Label Image

Figure 3: Kaplan-meier Curves For The Primary Composite Endpoint (a), Cardiovascular Death (b), And Heart Failure Hospitalization (c) (Image A)

Figure 3: Kaplan-meier Curves For The Primary Composite Endpoint (a), Cardiovascular Death (b), And Heart Failure Hospitalization (c) (Image A)
A Kaplan-Meier curve chart showing time to first occurrence of cardiovascular death or heart failure hospitalizations in the PARADIGM-HF study. The y-axis indicates cumulative failure rate percentage, and the x-axis shows time since randomization in days up to about 1,260 days. The chart compares Sacubitril and Valsartan tablets to Enalapril, with Sacubitril and Valsartan showing a lower cumulative failure rate over time.*
FDA Label Image

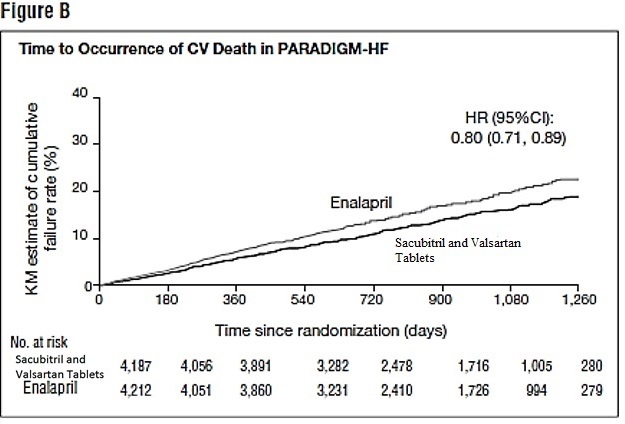
Image-b (Image B)

Image-b (Image B)
A Kaplan-Meier curve showing time to occurrence of cardiovascular death in the PARADIGM-HF study comparing Sacubitril and Valsartan tablets versus Enalapril, with cumulative failure rate (%) on the y-axis and time since randomization (days) on the x-axis. The graph includes hazard ratio (HR) with 95% confidence interval (CI) and number at risk for each treatment group over time.*
FDA Label Image

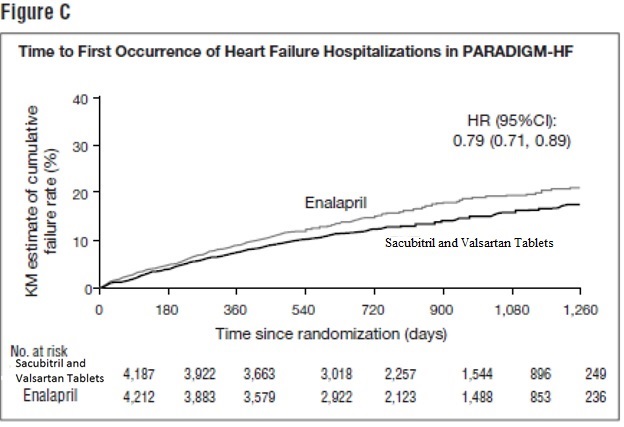
Image-c (Image C)

Image-c (Image C)
A Kaplan-Meier curve showing time to first occurrence of heart failure hospitalizations in the PARADIGM-HF study. The graph compares cumulative failure rates (%) over approximately 1,260 days following randomization between Sacubitril and Valsartan Tablets and Enalapril. Patient numbers at risk at various time points are provided below the graph.*
FDA Label Image

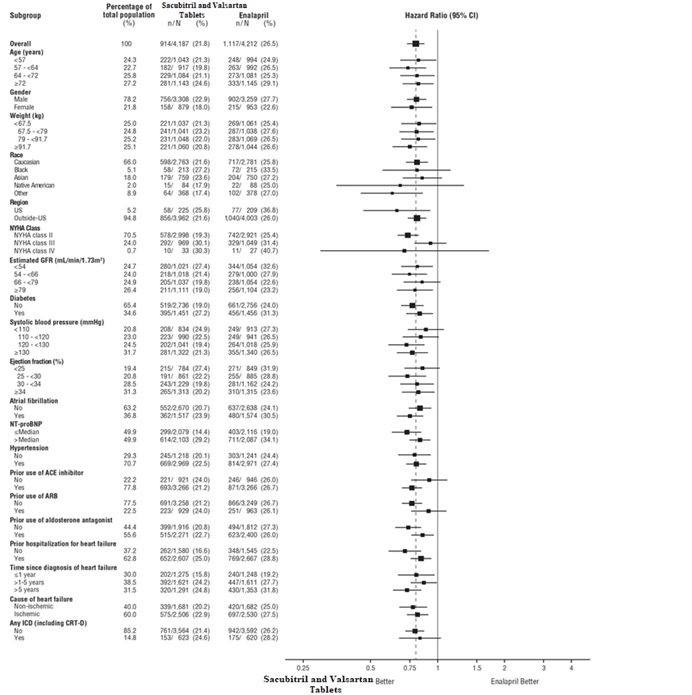
Image-d (Image D)

Image-d (Image D)
A forest plot comparing the hazard ratios of Sacubitril and Valsartan tablets versus Enalapril across various subgroups, including age, sex, weight, race, region, NYHA class, kidney function, diabetes status, blood pressure, ejection fraction, atrial fibrillation, NT-proBNP levels, hypertension, prior medication use, heart failure duration, and cause of heart failure. The plot shows point estimates with confidence intervals for each subgroup, illustrating relative risk between the two treatments.*
FDA Label Image

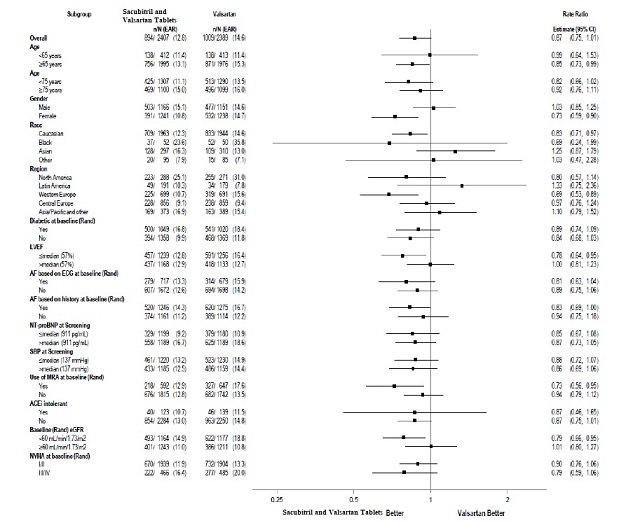
Figure-6 (Fig 6)

Figure-6 (Fig 6)
A forest plot comparing the efficacy or outcome rates of Sacubitril and Valsartan tablets versus Valsartan alone across various subgroups, including overall population, age, gender, race, region, diabetes status, liver function, presence of atrial fibrillation, prior history, and other clinical measurements. The plot displays rate ratios with confidence intervals, indicating comparative effects within each subgroup.*
FDA Label Image

Figure-7 (Fig 7)

Figure-7 (Fig 7)
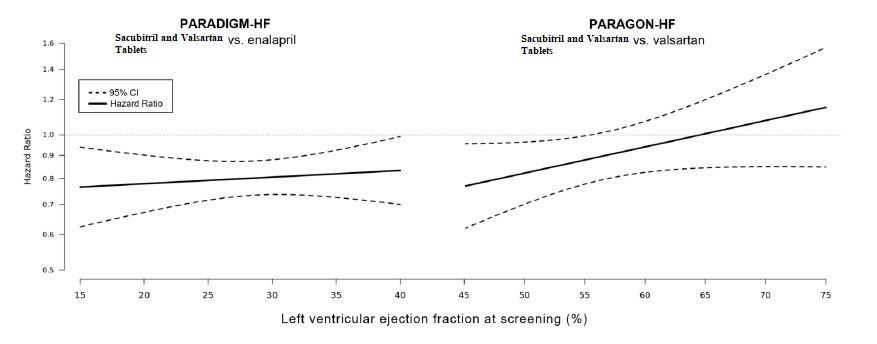
Two line graphs comparing hazard ratios with 95% confidence intervals for sacubitril and valsartan tablets versus enalapril and valsartan, respectively. The x-axis represents left ventricular ejection fraction (%) and the y-axis shows hazard ratio values. The graphs illustrate risk trends in PARADIGM-HF and PARAGON-HF studies.*
FDA Label Image

Figure 2: Pharmacokinetics Of Sacubitril And Valsartan Tablets In Specific Populations (Figure 2)

Figure 2: Pharmacokinetics Of Sacubitril And Valsartan Tablets In Specific Populations (Figure 2)
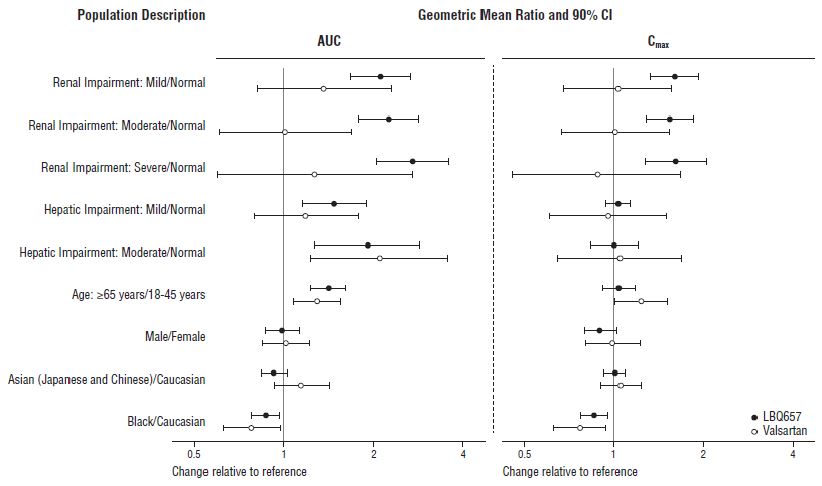
A forest plot showing the geometric mean ratio and 90% confidence intervals for AUC and Cmax comparing LBQ657 and Valsartan across different population subgroups including renal impairment severities, hepatic impairment severities, age groups, sex, and ethnicities.*
FDA Label Image

Figure 5: Mean Number Of Events Over Time For The Primary Composite Endpoint Of Total Hf Hospitalizations And Cv Death (Figure 5)

Figure 5: Mean Number Of Events Over Time For The Primary Composite Endpoint Of Total Hf Hospitalizations And Cv Death (Figure 5)
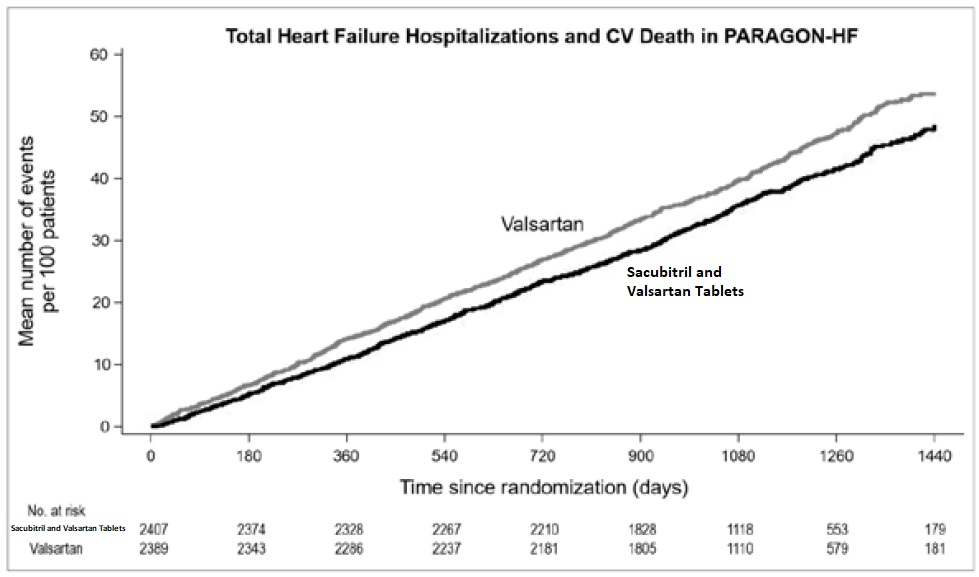
A line graph titled 'Total Heart Failure Hospitalizations and CV Death in PARAGON-HF' showing mean number of events per 100 patients over time since randomization in days. Two lines compare Sacubitril and Valsartan Tablets versus Valsartan alone, with Sacubitril and Valsartan showing a consistently lower number of events. A table below the graph lists numbers at risk for both groups at multiple time points up to 1440 days.*
FDA Label Image

Sacubitril Sodium (Sacubitril Sodium)

Sacubitril Sodium (Sacubitril Sodium)
Chemical structure of Sacubitril, one of the active ingredients in the Sacubitril and Valsartan medication. The diagram shows the molecular structure with labeled atoms and bonds characteristic of Sacubitril's chemical formula.*
FDA Label Image

Valsartan Disodium (Valsartan Disodium)

Valsartan Disodium (Valsartan Disodium)
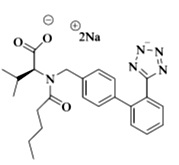
Chemical structure of the active ingredient Sacubitril and Valsartan, showing molecular connectivity and arrangement of atoms.*

* About these descriptions: Image descriptions on this page are generated by automated AI analysis of the product label images from the manufacturer's FDA label submission (SPL). They are provided for reference only and may contain errors or omissions. Always rely on the printed label itself and the official FDA labeling, and consult a pharmacist or healthcare professional with any questions about this product.