Liraglutide Injection
Product Images NDC 70377-094

View Photos of Packaging, Regulatory Labels, and Product Appearance

Product Visual Gallery

This gallery contains 30 technical images submitted to the FDA as part of the official labeling for Liraglutide (NDC 70377-094). Unlike standard consumer photos, these assets often include clinical data figures, molecular chemical structures, and official manufacturer packaging layouts.

As provided by Biocon Pharma Inc., these visuals offer a comprehensive scientific overview of the product's physical and chemical identity, aiding pharmacists and researchers in product verification and study.

FDA Label Image

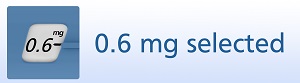
Fig. L-1.jpg (0.6 mg)
FDA Label Image

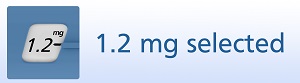
Fig. L-2.jpeg (1.2 mg)

FDA Label Image

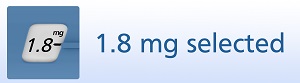
Fig. L-3.jpg (1.8mg)

Fig. L-3.jpg (1.8mg)
Illustration showing a digital dosage selection screen with 1.8 mg selected. The screen background is blue with white and gray elements. The selected dosage appears prominently on the display.*
FDA Label Image

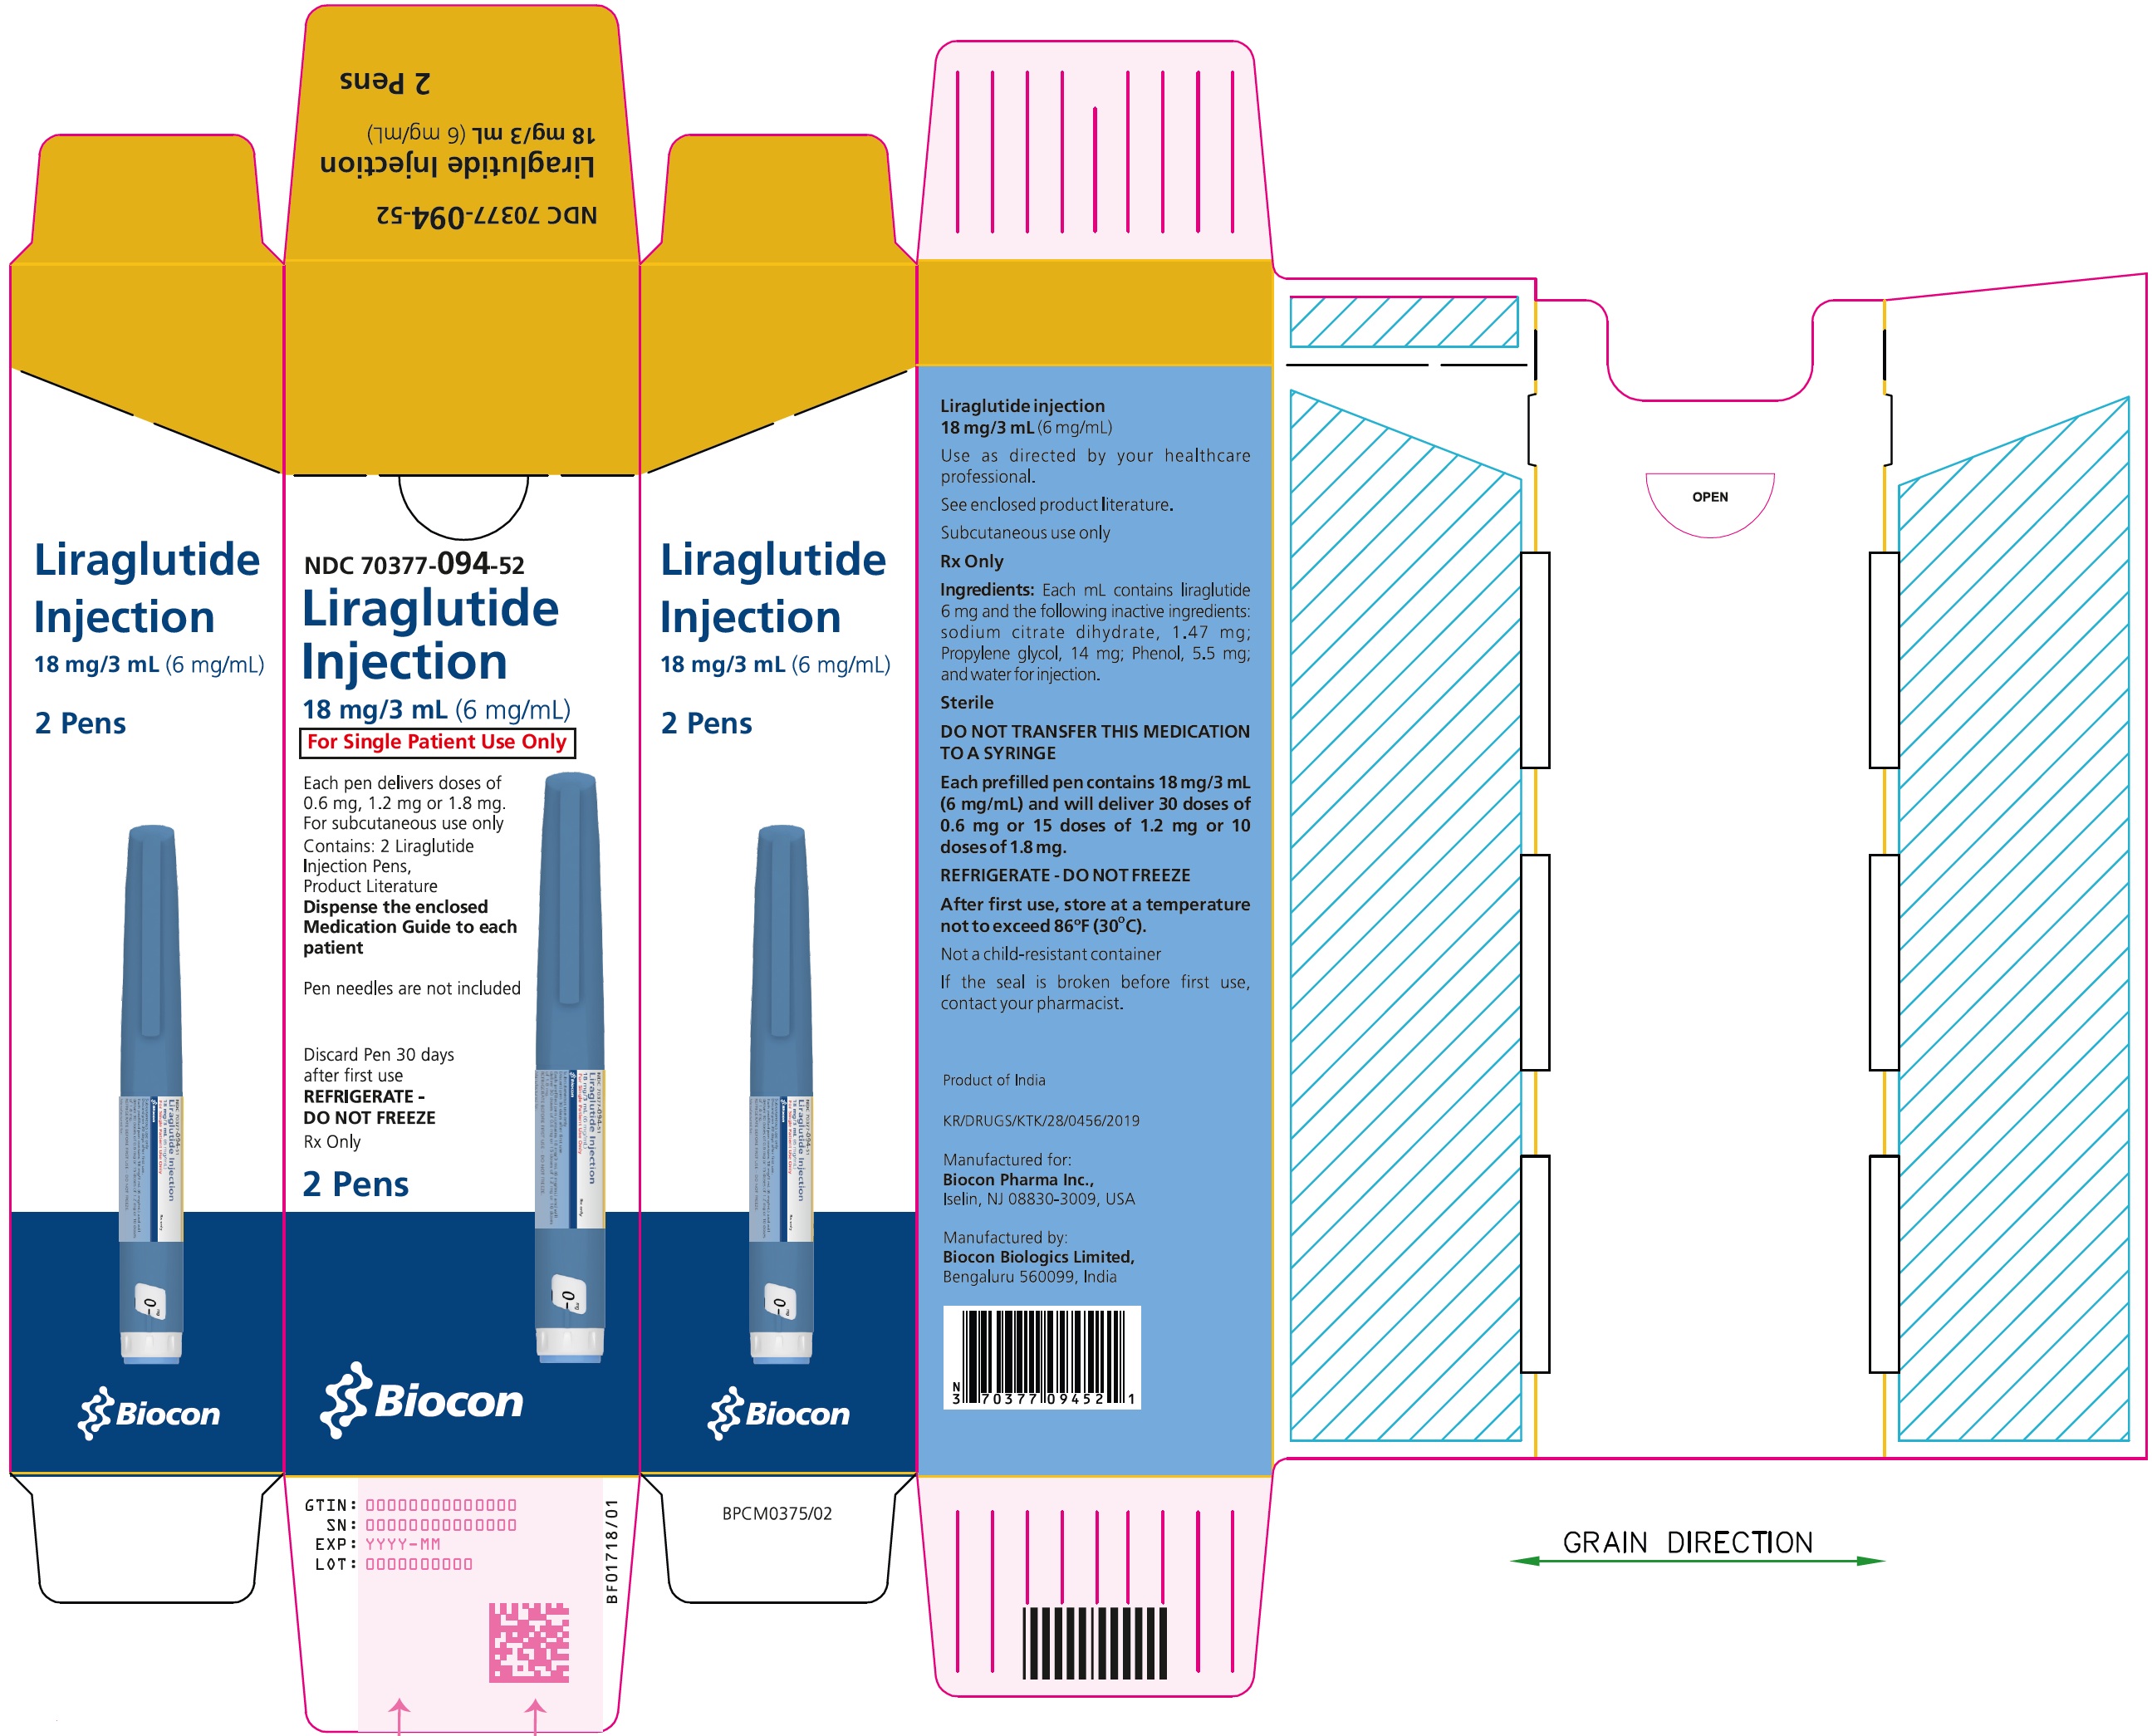
Liraglutide Injection Carton 2-pens (2 Pens)

Liraglutide Injection Carton 2-pens (2 Pens)
Packaging label for Liraglutide Injection 18 mg/3 mL (6 mg/mL) manufactured by Biocon Pharma Inc., containing 2 prefilled pens. The label includes product name, strength, quantity, and usage instructions, emphasizing subcutaneous use, refrigeration requirements, and single-patient use only. The box design features images of the injection pens and Biocon logo with regulatory and ingredient information.*
FDA Label Image

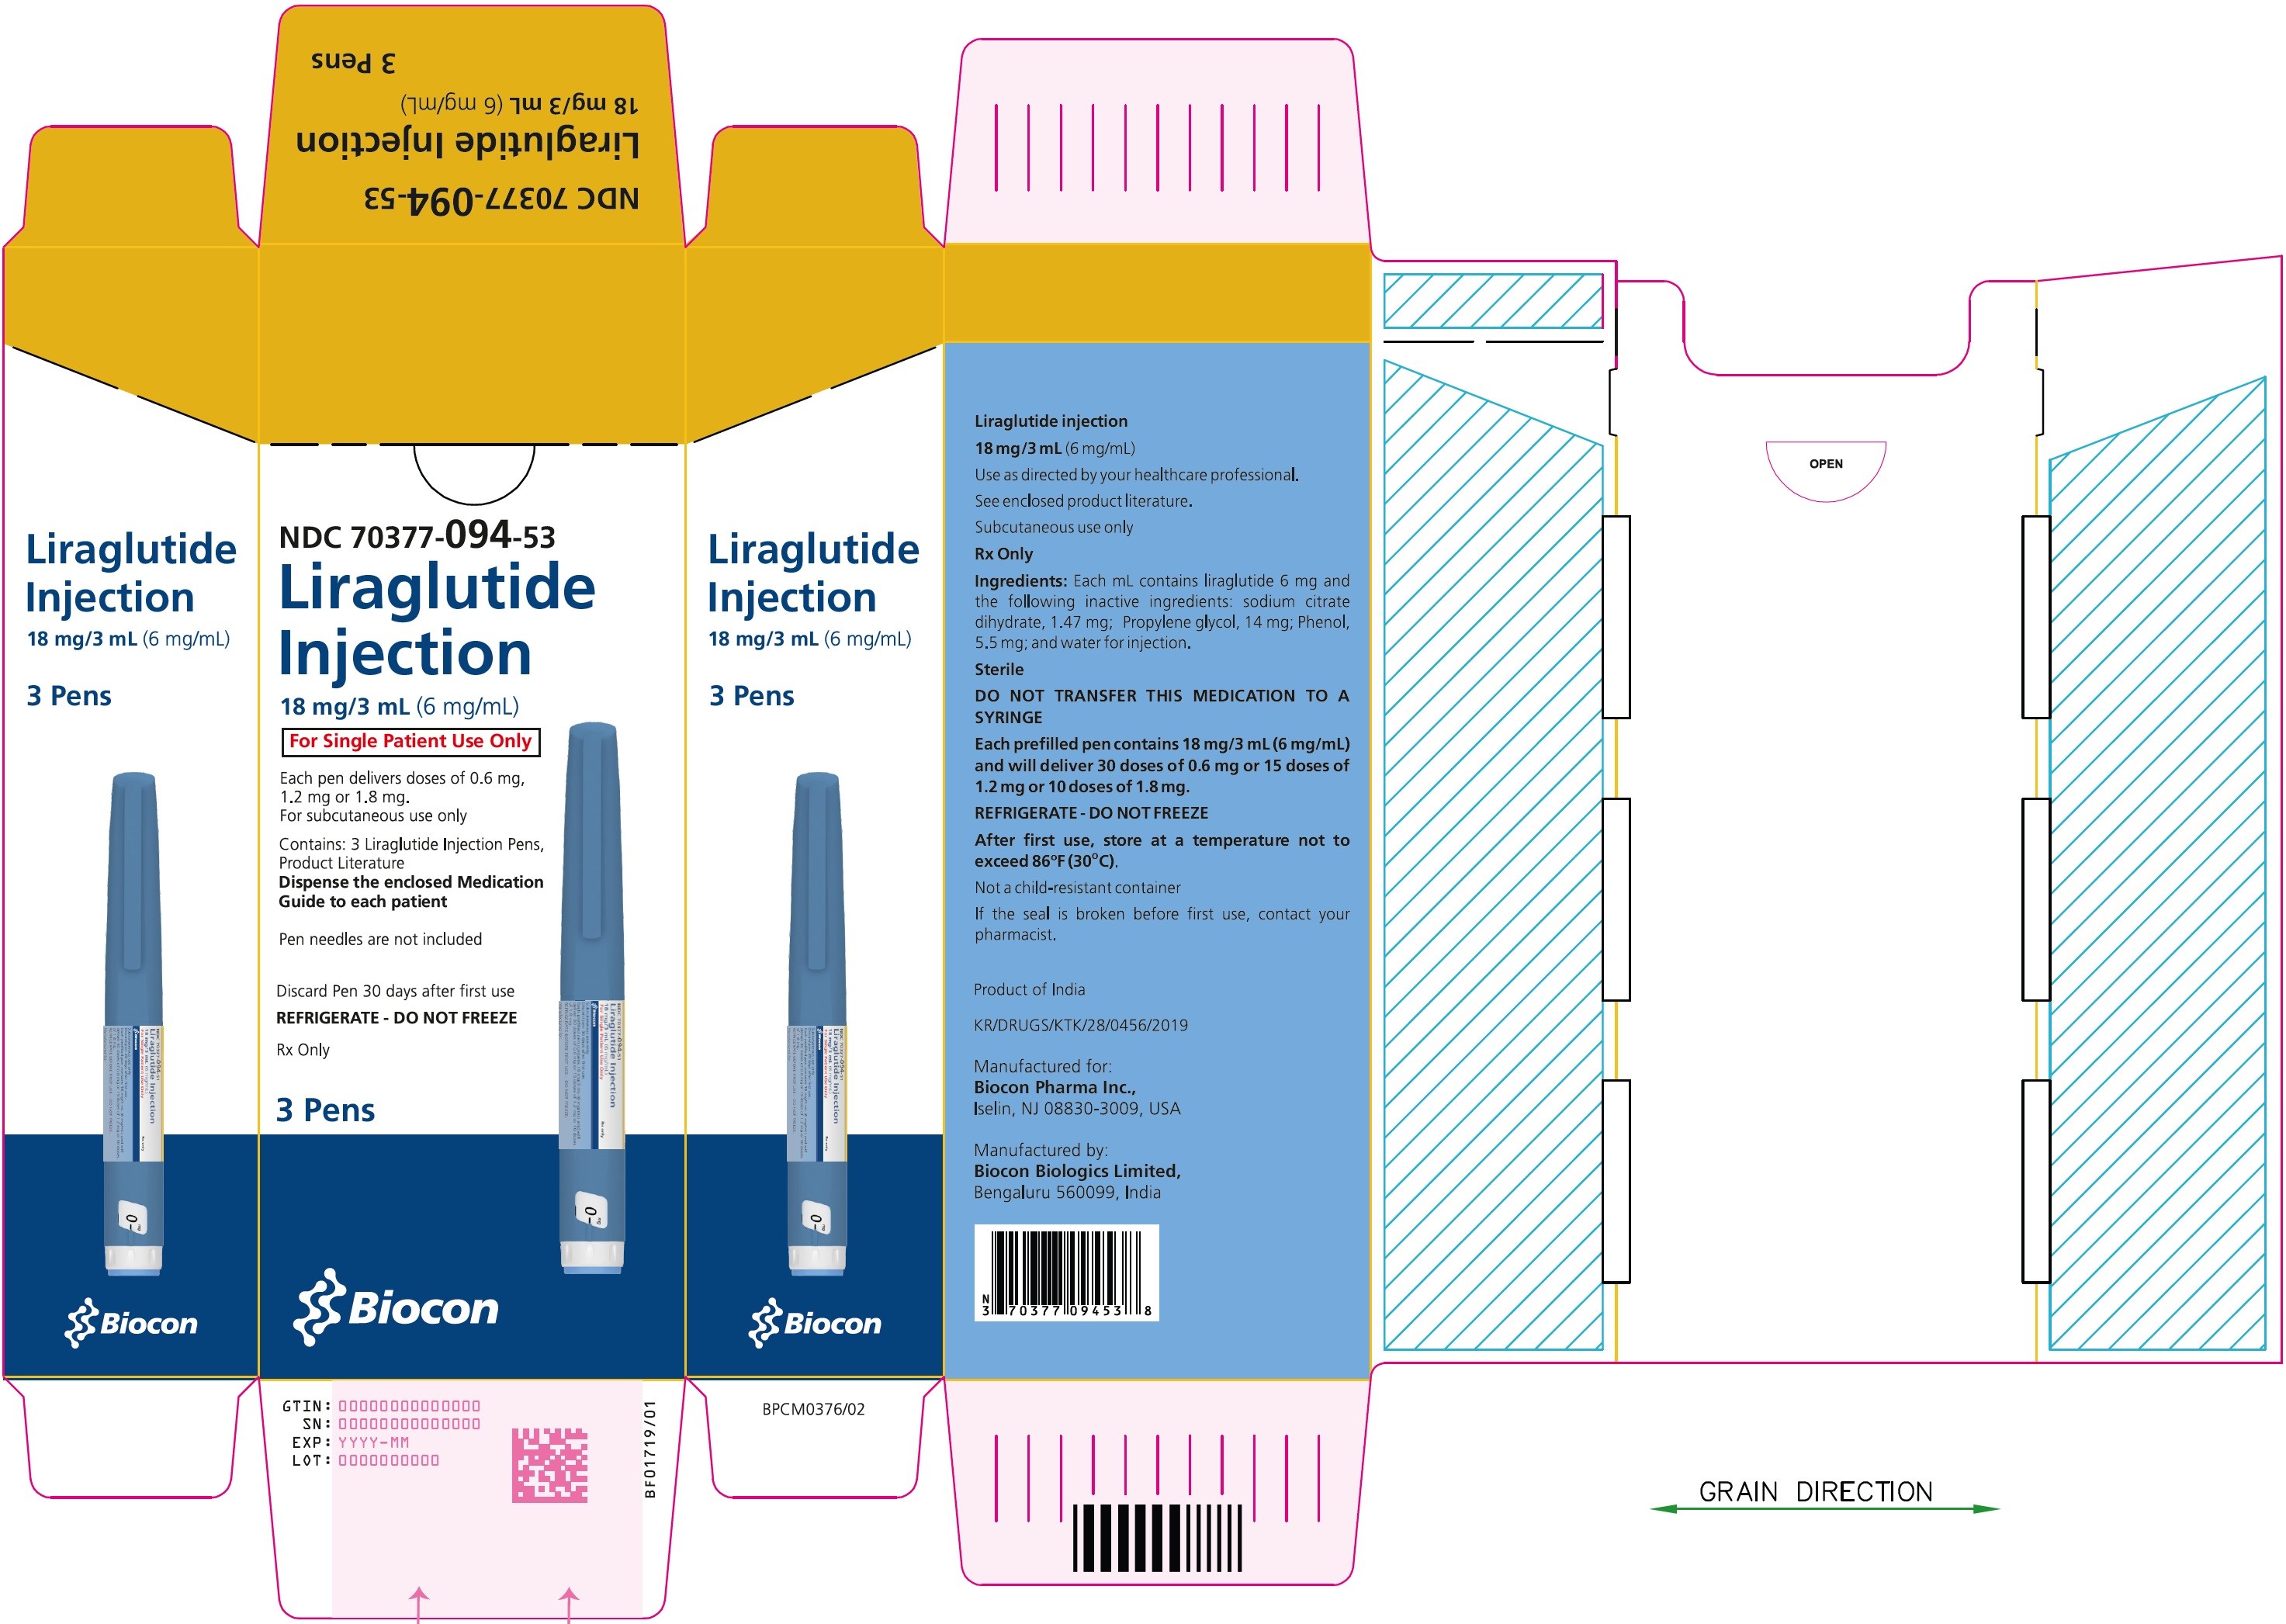
Liraglutide Injection Carton 3-pens (3 Pens)

Liraglutide Injection Carton 3-pens (3 Pens)
Packaging label for Liraglutide Injection 18 mg/3 mL (6 mg/mL) by Biocon Pharma Inc. The package contains 3 prefilled pens for subcutaneous injection. Label features include dosage strength, usage instructions, ingredients, storage instructions, and images of the injection pens. The label displays brand and generic names, NDC 70377-094-53, and manufacturer information.*
FDA Label Image

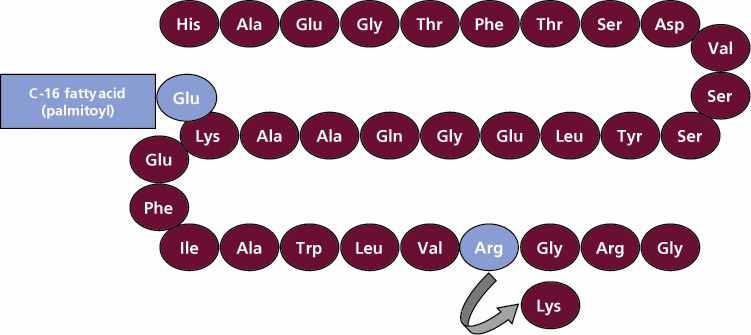
Figure 1: Structural Formula Of Liraglutide (49f302f5 F315 48b8 83a4 6ca56f01fded 01)

Figure 1: Structural Formula Of Liraglutide (49f302f5 F315 48b8 83a4 6ca56f01fded 01)
Illustration showing the amino acid sequence of liraglutide with labeled residues in a linear schematic. It highlights a C-16 fatty acid (palmitoyl) attached to a glutamic acid (Glu) residue, with specific amino acids such as arginine (Arg) and lysine (Lys) indicated in blue circles, and the rest in maroon circles, indicating the peptide structure of liraglutide.*
FDA Label Image

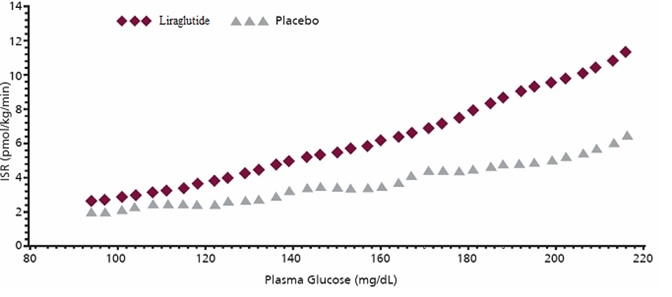
Figure 2 Mean Insulin Secretion Rate (isr) Versus Glucose Concentration (49f302f5 F315 48b8 83a4 6ca56f01fded 02)

Figure 2 Mean Insulin Secretion Rate (isr) Versus Glucose Concentration (49f302f5 F315 48b8 83a4 6ca56f01fded 02)
A scatter plot comparing insulin secretion rates (ISR in pmol/kg/min) against plasma glucose levels (mg/dL) for Liraglutide and placebo. Data points for Liraglutide are represented by dark diamonds and show a higher insulin secretion rate across glucose concentrations compared to gray triangles representing placebo.*
FDA Label Image

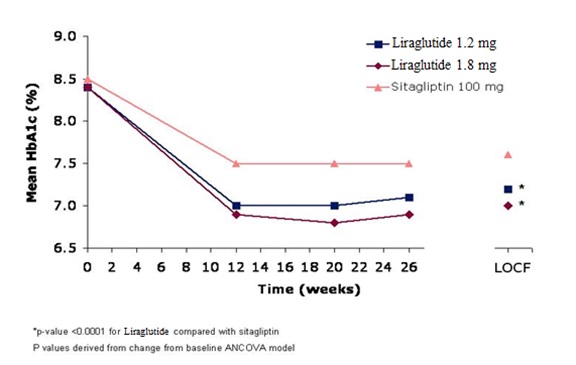
Figure 4 Mean Hba1c For Patients Who Completed The 26-week Trial And For The Last Observation Carried Forward (locf, Intent-to-treat) Data At Week 26 (49f302f5 F315 48b8 83a4 6ca56f01fded 04)

Figure 4 Mean Hba1c For Patients Who Completed The 26-week Trial And For The Last Observation Carried Forward (locf, Intent-to-treat) Data At Week 26 (49f302f5 F315 48b8 83a4 6ca56f01fded 04)
A line graph depicting the mean HbA1c percentage over 26 weeks comparing Liraglutide 1.2 mg and 1.8 mg doses with Sitagliptin 100 mg. The vertical axis shows mean HbA1c (%) from 6.5 to 9.0, and the horizontal axis shows time in weeks from 0 to 26. Both Liraglutide doses demonstrate a greater reduction in HbA1c compared to Sitagliptin over time.*
FDA Label Image

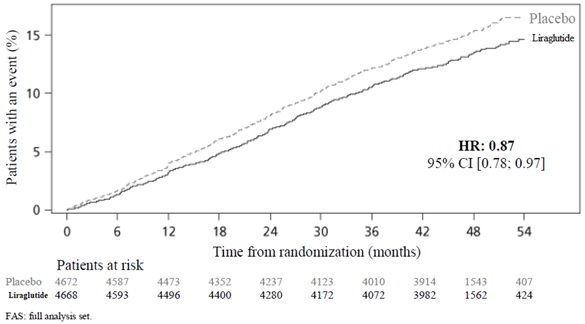
Figure-5 (Figure 5)

Figure-5 (Figure 5)
A Kaplan-Meier curve displaying the percentage of patients with an event over time in months from randomization, comparing liraglutide and placebo groups. The graph shows lower event rates for liraglutide compared to placebo, with a hazard ratio (HR) of 0.87 and a 95% confidence interval of 0.78 to 0.97. Patient numbers at risk are listed below the x-axis for both groups at various time points up to 54 months.*
FDA Label Image

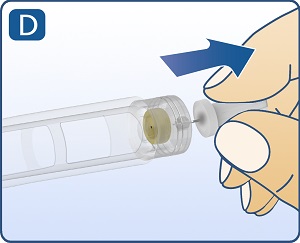
Figure-d (Figure D)

Figure-d (Figure D)
An instructional illustration depicting a hand removing or pulling off a protective cap from the tip of a Liraglutide 6 mg/mL subcutaneous injection pen. The image shows the action of detaching the cap prior to administration.*
FDA Label Image

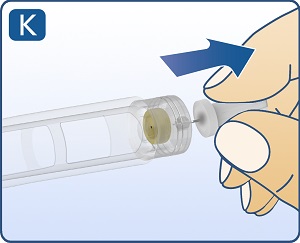
Figure K (Figure K)

Figure K (Figure K)
An instructional illustration showing a hand removing a cap from the tip of a prefilled injection pen, likely for subcutaneous administration of Liraglutide 6 mg/mL by Biocon Pharma Inc.*
FDA Label Image

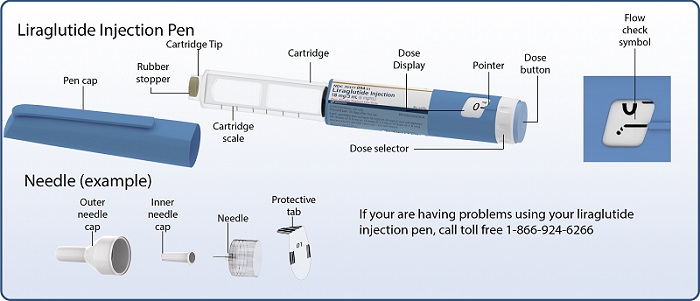
Victoza Pen And Needle (Image 01)

Victoza Pen And Needle (Image 01)
An illustrated diagram of the Liraglutide Injection Pen showing labeled parts including the pen cap, rubber stopper, cartridge tip, cartridge, dose display, pointer, dose selector, dose button, and flow check symbol. It also includes illustrations of the needle components: outer needle cap, inner needle cap, needle, and protective tab, with a customer service number for assistance.*
FDA Label Image

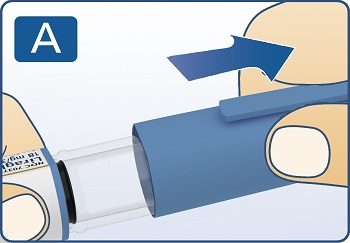
Fig. A (Pull off pen cap)

Fig. A (Pull off pen cap)
An instructional illustration showing a hand holding a liraglutide injection pen with the cap being removed by pulling it upwards. The image is labeled with a blue box containing the letter 'A' in the top left corner, indicating the first step in a usage guide.*
FDA Label Image

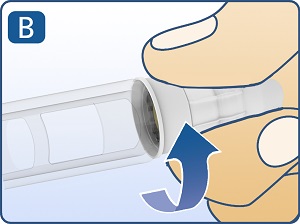
Fig. B (Remove protective tab.)

Fig. B (Remove protective tab.)
An instructional illustration showing a hand gripping a syringe-like injection device and twisting the cap off with a blue curved arrow indicating the direction to remove the cap. The image highlights the step of preparing the Liraglutide injection for use.*
FDA Label Image

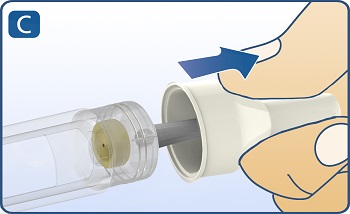
Fig. C (Image 04)

Fig. C (Image 04)
An instructional illustration showing a person removing a protective cap from a pen injector device for a subcutaneous injection. The image highlights the action of pulling the cap away from the pen with an arrow indicating the direction.*
FDA Label Image

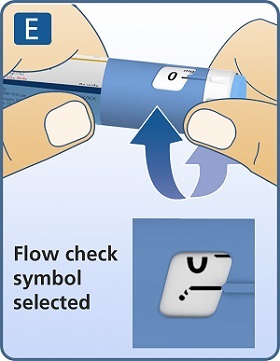
Fig. E (Image 05)

Fig. E (Image 05)
An instructional illustration showing how to select the flow check symbol on a Liraglutide 6 mg/mL injection pen. The image depicts hands rotating a dial on the pen to align a flow check symbol, indicating readiness for injection.*
FDA Label Image

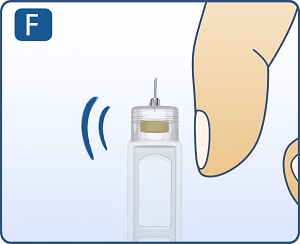
Fig. F (Image 06)

Fig. F (Image 06)
An instructional illustration showing a close-up of a finger near the top of a liraglutide injection pen, with motion lines indicating a tapping or shaking action. The image appears to demonstrate a step in the preparation or use of the subcutaneous injection device.*
FDA Label Image

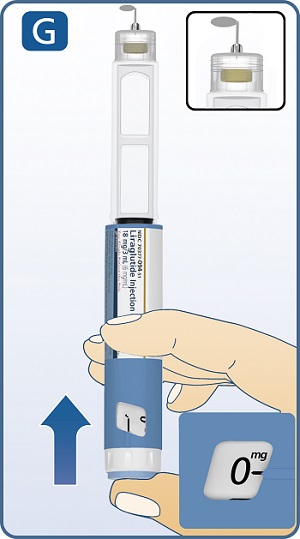
Fig. G (Image 07)

Fig. G (Image 07)
An instructional illustration showing a hand holding a Liraglutide 6 mg/mL injection pen by Biocon Pharma Inc. The pen is being prepared for use, with an upward arrow indicating the removal of the pen cap. A close-up inset highlights the injection needle with a protective cover. Another inset shows the dose display marked at 0 mg.*
FDA Label Image

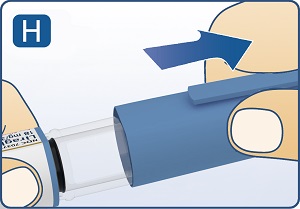
Fig. H (Image 08)

Fig. H (Image 08)
An instructional illustration depicting a hand peeling off the blue protective cap from a syringe containing liraglutide injection. The image emphasizes the step of removing the cap prior to subcutaneous administration.*
FDA Label Image

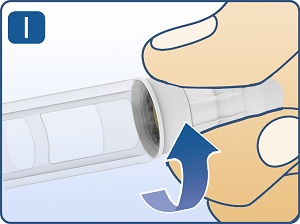
Fig. I (Image 09)

Fig. I (Image 09)
An instructional illustration showing a hand holding a Liraglutide injection pen. The image highlights removing or twisting a protective cap from the pen's needle end, indicated by a blue upward curved arrow. It helps users prepare the subcutaneous injection pen for use.*
FDA Label Image

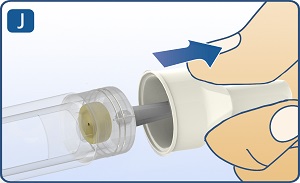
Fig. J (Image 10)

Fig. J (Image 10)
Instructional illustration showing the removal of a protective cap from the needle of an injection device. The image depicts a hand pulling the cap away from the needle, which is attached to a syringe barrel, likely for subcutaneous injection use.*
FDA Label Image

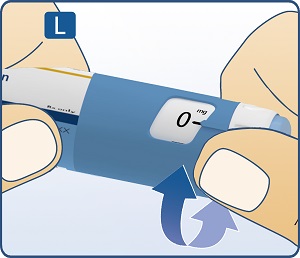
Fig. L (Image 11)

Fig. L (Image 11)
An instructional illustration showing hands adjusting the dose selector on a Liraglutide injection pen. The dose window displays '0 mg,' and an arrow indicates the direction to turn the dose knob for dose selection.*
FDA Label Image

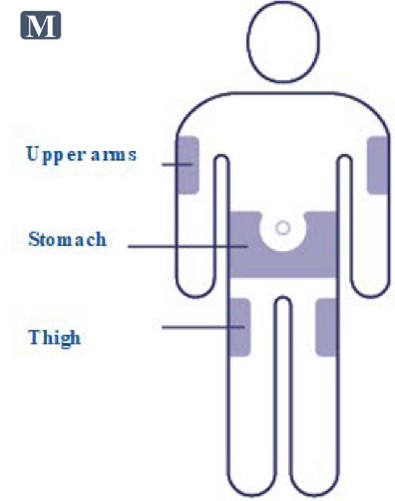
Fig. M (Image 12)

Fig. M (Image 12)
An instructional diagram showing recommended injection sites on a human figure for subcutaneous administration. Highlighted areas include the upper arms, stomach, and thighs with corresponding labels indicating these as injection locations.*
FDA Label Image

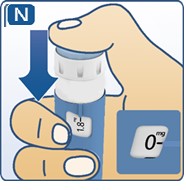
Fig. N (Image 13)

Fig. N (Image 13)
An instructional illustration showing a hand holding a medication pen injector, pressing down on the top to administer a dose. The inset displays the pen's dose window set to 0 mg, indicating readiness or dose completion. The image likely demonstrates the injection or dose setting process for a subcutaneous injection pen.*
FDA Label Image

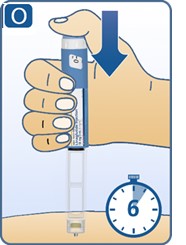
Fig. O (Image 14)

Fig. O (Image 14)
An instructional illustration showing a hand holding a prefilled injection pen with an arrow indicating to press down on the pen. A stopwatch icon displays the number 6, likely indicating to hold the press for 6 seconds. This image is related to the subcutaneous injection administration of Liraglutide 6 mg/mL, produced by Biocon Pharma Inc.*
FDA Label Image

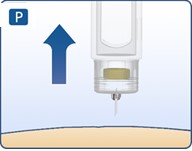
Fig. P (Image 15)

Fig. P (Image 15)
An instructional illustration showing the tip of a subcutaneous injection device positioned above the skin with an upward-pointing arrow indicating the direction of the injection or needle insertion.*
FDA Label Image

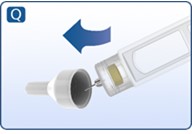
Fig. Q (Image 16)

Fig. Q (Image 16)
An instructional diagram showing the assembly step of a prefilled injection device for Liraglutide 6 mg/mL. The image depicts a cap being removed from the injection pen with an arrow indicating the direction of removal, preparing the device for subcutaneous use.*
FDA Label Image

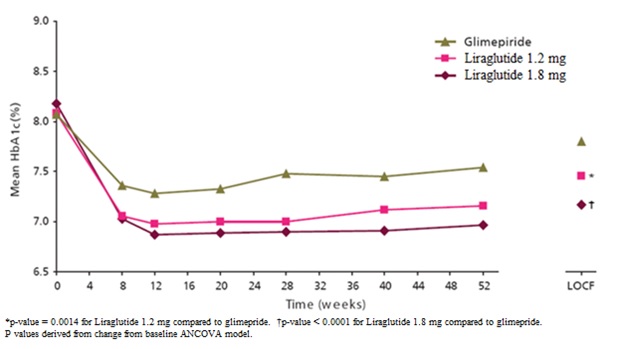
Figure 3 (Image 21)

Figure 3 (Image 21)
A line graph depicting the mean HbA1c (%) levels over 52 weeks for three treatments: Glimepiride, Liraglutide 1.2 mg, and Liraglutide 1.8 mg. The x-axis represents time in weeks, and the y-axis represents mean HbA1c percentage. Both Liraglutide doses show a greater reduction in HbA1c compared to Glimepiride over time.*
FDA Label Image

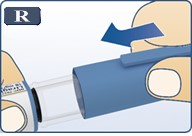
Image-r (Image R)

Image-r (Image R)
An instructional illustration showing a hand holding a liraglutide injection pen with the thumb positioned to push the blue button on the pen, indicating how to administer a subcutaneous injection. The illustration includes a small 'R' symbol in the top left corner.*
FDA Label Image

Image-jpeg (Symbol)

Image-jpeg (Symbol)
Liraglutide injection packaging label from Biocon Pharma Inc. The label indicates a 6 mg/mL concentration and a 3 mL solution in a prefilled pen injector. The label features the brand name 'Liraglutide' prominently and includes dosing information, warnings, storage instructions, and regulatory compliance details.*

* About these descriptions: Image descriptions on this page are generated by automated AI analysis of the product label images from the manufacturer's FDA label submission (SPL). They are provided for reference only and may contain errors or omissions. Always rely on the printed label itself and the official FDA labeling, and consult a pharmacist or healthcare professional with any questions about this product.