Galantamine Tablet, Film Coated
Product Images NDC 70436-004

16 FDA label images from Slate Run Pharmaceuticals, Llc · Packaging, Regulatory Labels, and Product Appearance

Product Visual Gallery

This gallery contains 16 technical images submitted to the FDA as part of the official labeling for Galantamine (NDC 70436-004). Unlike standard consumer photos, these assets often include clinical data figures, molecular chemical structures, and official manufacturer packaging layouts.

As provided by Slate Run Pharmaceuticals, Llc, these visuals offer a comprehensive scientific overview of the product's physical and chemical identity, aiding pharmacists and researchers in product verification and study.

FDA Label Image

Chemical Structure (Galantamine 01)
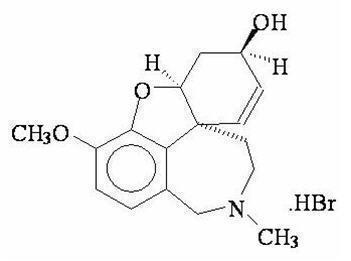
Chemical Structure (Galantamine 01)
Chemical structure of galantamine hydrobromide, showing the molecular arrangement including a methoxy group, hydroxyl group, and nitrogen-containing ring system.*
FDA Label Image

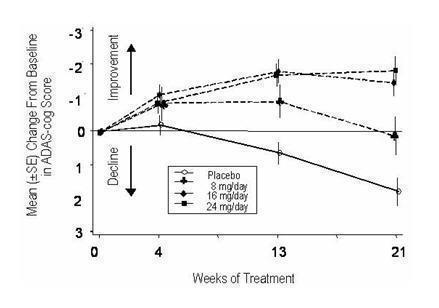
Image Description (Galantamine 02)

Image Description (Galantamine 02)
A line graph depicting the mean change from baseline in ADAS-cog score over 21 weeks of treatment. The graph compares placebo and three daily doses of galantamine (8 mg, 16 mg, and 24 mg), showing improvement and decline trends across the treatment period with error bars for standard error of the mean.*
FDA Label Image

Image Description (Galantamine 04)

Image Description (Galantamine 04)
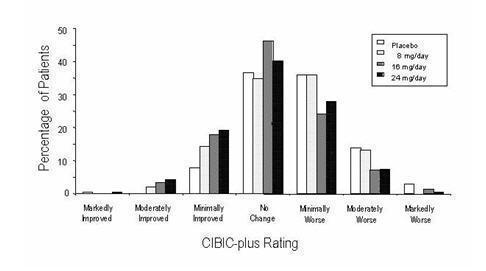
A bar chart depicting the CIBIC-plus ratings for patients receiving placebo or galantamine at doses of 8 mg/day, 16 mg/day, and 24 mg/day. The horizontal axis categorizes patient outcomes from markedly improved to markedly worse, while the vertical axis shows the percentage of patients for each category and treatment group.*
FDA Label Image

Image Description (Galantamine 05)

Image Description (Galantamine 05)
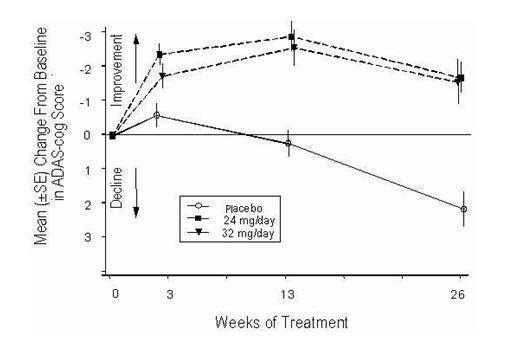
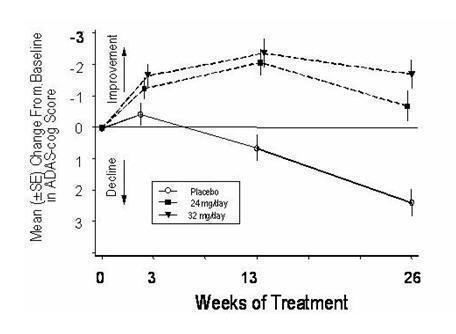
A line graph showing mean change from baseline in ADAS-cog score versus weeks of treatment. The graph compares placebo, 24 mg/day, and 32 mg/day groups over 0, 3, 13, and 26 weeks, indicating trends in cognitive improvement or decline during the treatment period.*
FDA Label Image

Image Description (Galantamine 06)

Image Description (Galantamine 06)
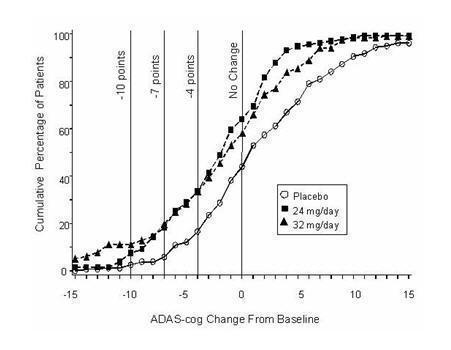
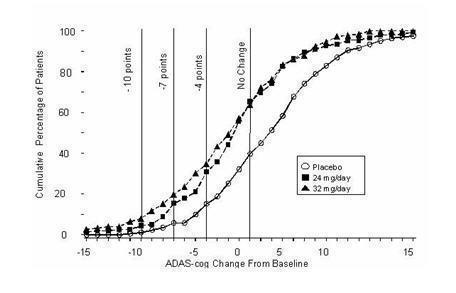
A cumulative percentage graph showing ADAS-cog change from baseline on the x-axis and cumulative percentage of patients on the y-axis. It compares placebo, 24 mg/day, and 32 mg/day treatment groups, illustrating patient response distributions over a range of cognitive score changes.*
FDA Label Image

Image Description (Galantamine 07)

Image Description (Galantamine 07)
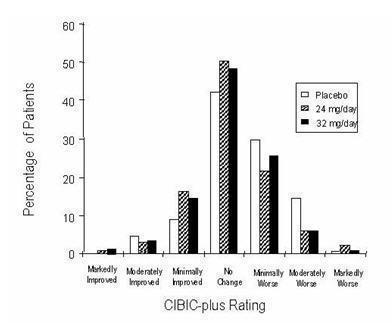
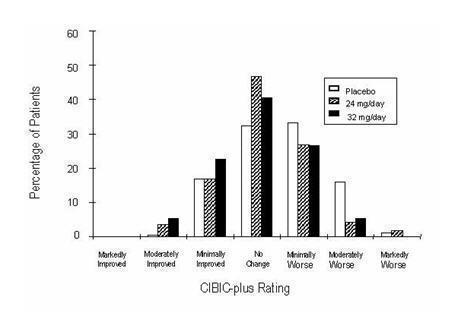
A bar graph depicting patient outcomes based on CIBIC-plus ratings for placebo, 24 mg/day, and 32 mg/day doses of galantamine. The vertical axis shows the percentage of patients, and the horizontal axis lists categories from markedly improved to markedly worse. The graph compares the distribution of patient responses across these treatment groups.*
FDA Label Image

Image Description (Galantamine 08)

Image Description (Galantamine 08)
This line graph depicts the mean change from baseline in ADAS-Cog scores over 26 weeks of treatment, comparing placebo with two dosage levels (24 mg/day and 32 mg/day). The y-axis shows score changes with improvement and decline indicators, and the x-axis shows treatment duration in weeks. Both dosages demonstrate score improvement over time compared to placebo, which shows decline.*
FDA Label Image

Image Description (Galantamine 09)

Image Description (Galantamine 09)
A line graph showing the cumulative percentage of patients on the y-axis against changes from baseline in the ADAS-cog score on the x-axis. The graph compares three groups: Placebo, 24 mg/day, and 32 mg/day treatment doses, illustrating variations in cognitive score improvement over the measured range.*
FDA Label Image

Image Description (Galantamine 10)

Image Description (Galantamine 10)
Bar chart depicting the percentage of patients according to CIBIC-plus Rating categories, comparing placebo, 24 mg/day, and 32 mg/day dosing groups. Categories range from markedly improved to markedly worse, showing the distribution of patient responses by treatment group.*
FDA Label Image

Image Description (Galantamine 11)

Image Description (Galantamine 11)
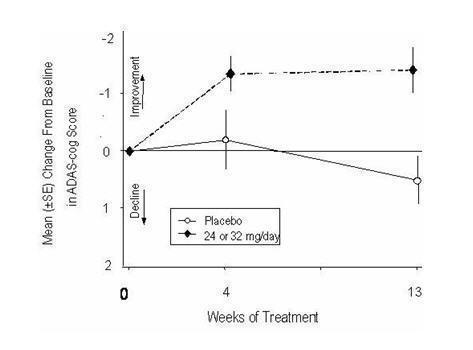
A line graph showing the mean change from baseline in ADAS-cog scores over weeks of treatment (0, 4, and 13 weeks). It compares two groups: placebo and 24 or 32 mg/day of galantamine. The vertical axis indicates improvement or decline, with error bars at each time point.*
FDA Label Image

Image Description (Galantamine 12)

Image Description (Galantamine 12)
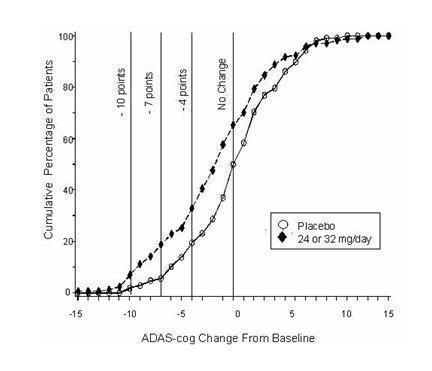
A cumulative percentage line graph comparing the cognitive change from baseline (ADAS-cog) between placebo and 24 or 32 mg/day treatment groups. The x-axis shows ADAS-cog change from -15 to 15, with vertical lines marking -10, -7, -4 points, and no change at 0. The y-axis represents cumulative percentage of patients from 0 to 100%. The graph shows greater improvements for the 24 or 32 mg/day group compared to placebo.*
FDA Label Image

Galantamine 12mg 60 Container Label

Galantamine 12mg 60 Container Label
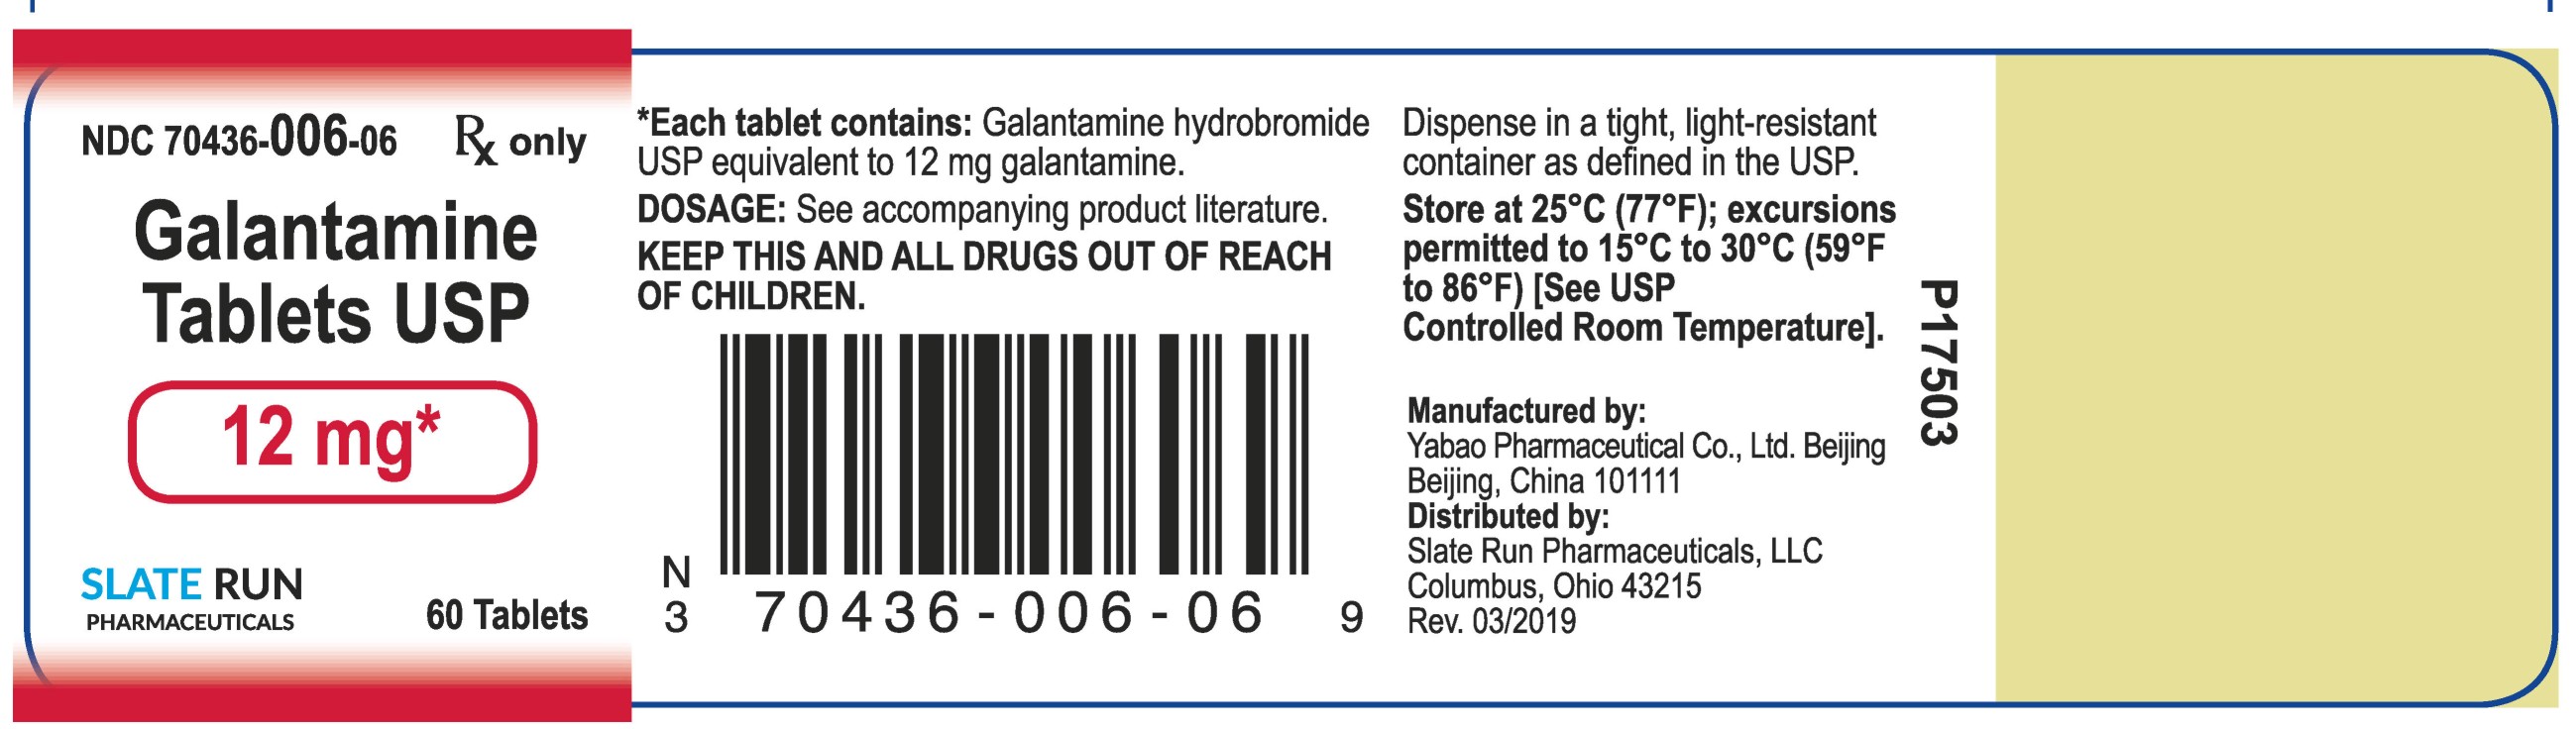
Label for Galantamine Tablets USP 12 mg film-coated tablets, a human prescription drug. The label shows the NDC 70436-006-06, contains 60 tablets, and is distributed by Slate Run Pharmaceuticals, LLC, Columbus, Ohio. The tablets contain galantamine hydrobromide equivalent to 12 mg galantamine and are manufactured by Yabao Pharmaceutical Co., Ltd., Beijing, China.*
FDA Label Image

Image Description (Galantamine 13)

Image Description (Galantamine 13)
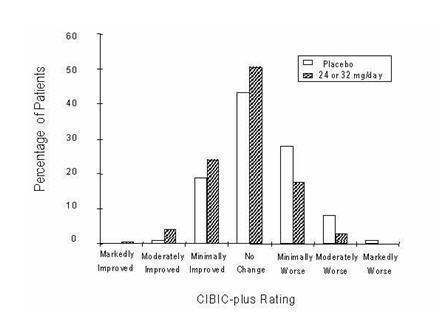
Bar chart comparing the percentage of patients by CIBIC-plus Rating categories between placebo and 24 or 32 mg/day galantamine treatment groups. Categories range from Markedly Improved to Markedly Worse, illustrating patient response distribution.*
FDA Label Image

Galantamine 4mg 60 Container Label

Galantamine 4mg 60 Container Label
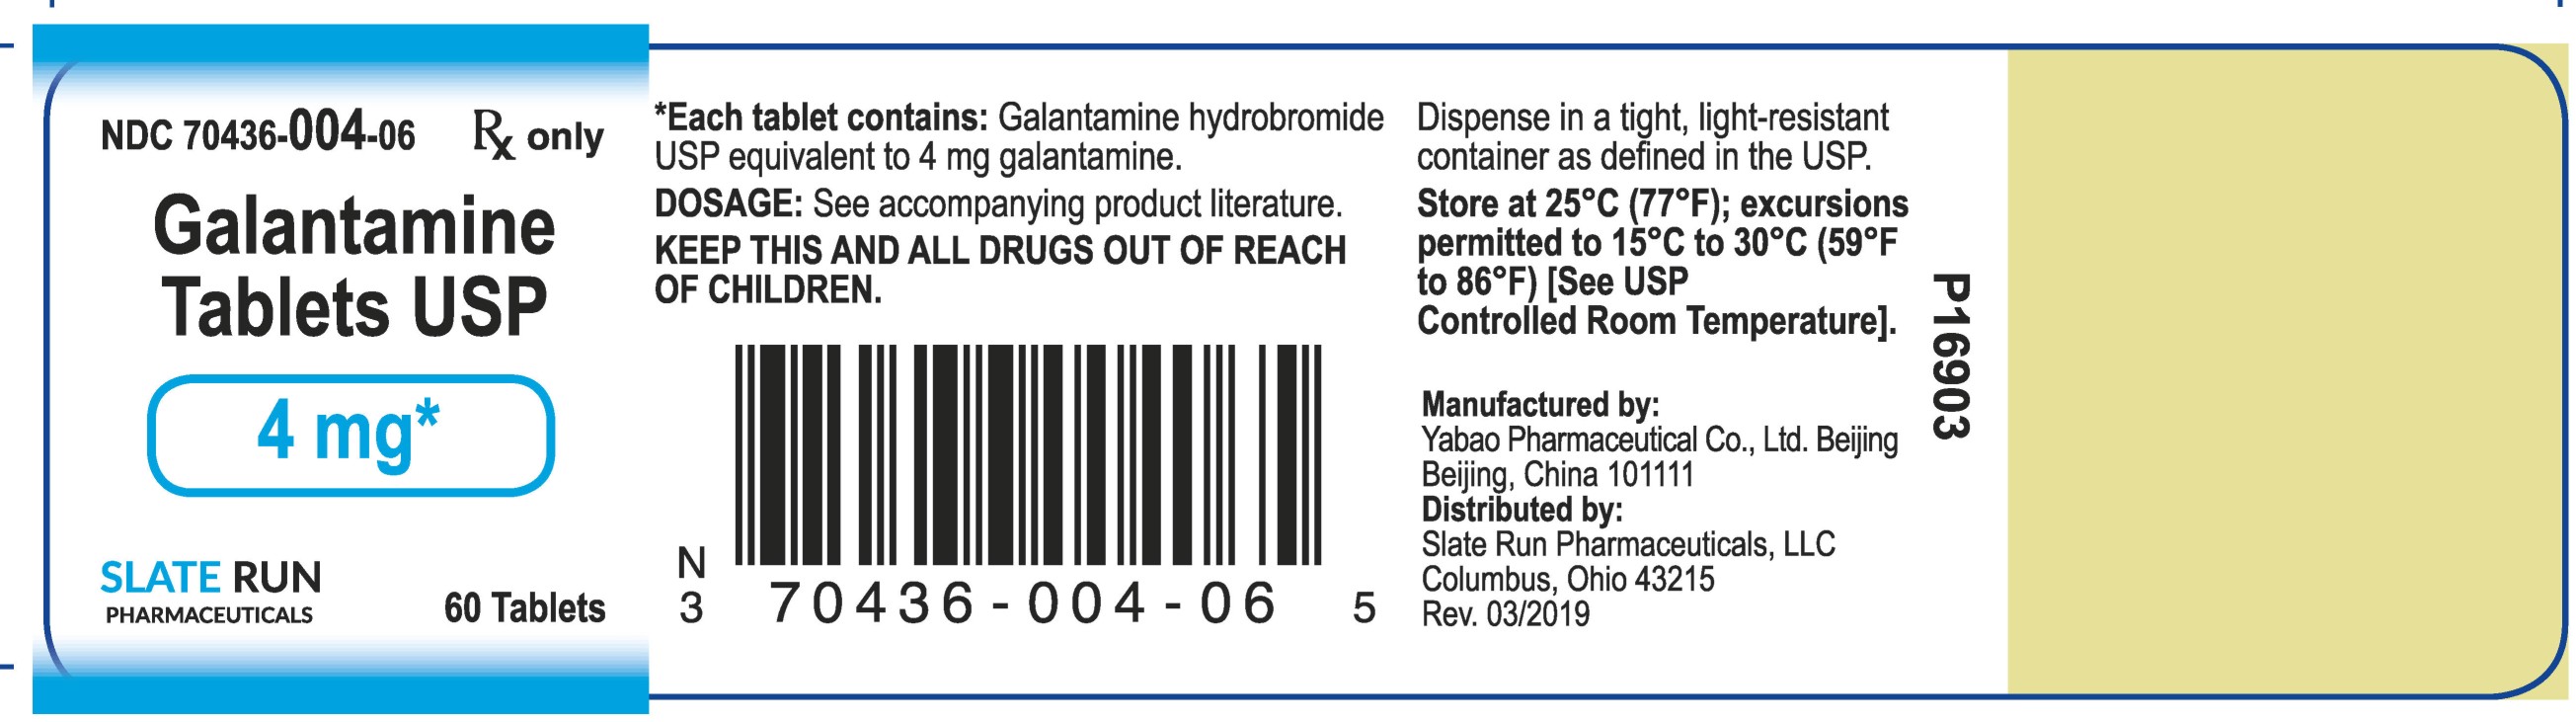
Galantamine Tablets USP 4 mg film-coated tablets label shows the prescription drug information including NDC 70436-004-06, manufactured by Yabao Pharmaceutical Co., Ltd. Beijing and distributed by Slate Run Pharmaceuticals, LLC. The label indicates each tablet contains galantamine hydrobromide equivalent to 4 mg galantamine, with a package size of 60 tablets, storage instructions, and a barcode.*
FDA Label Image

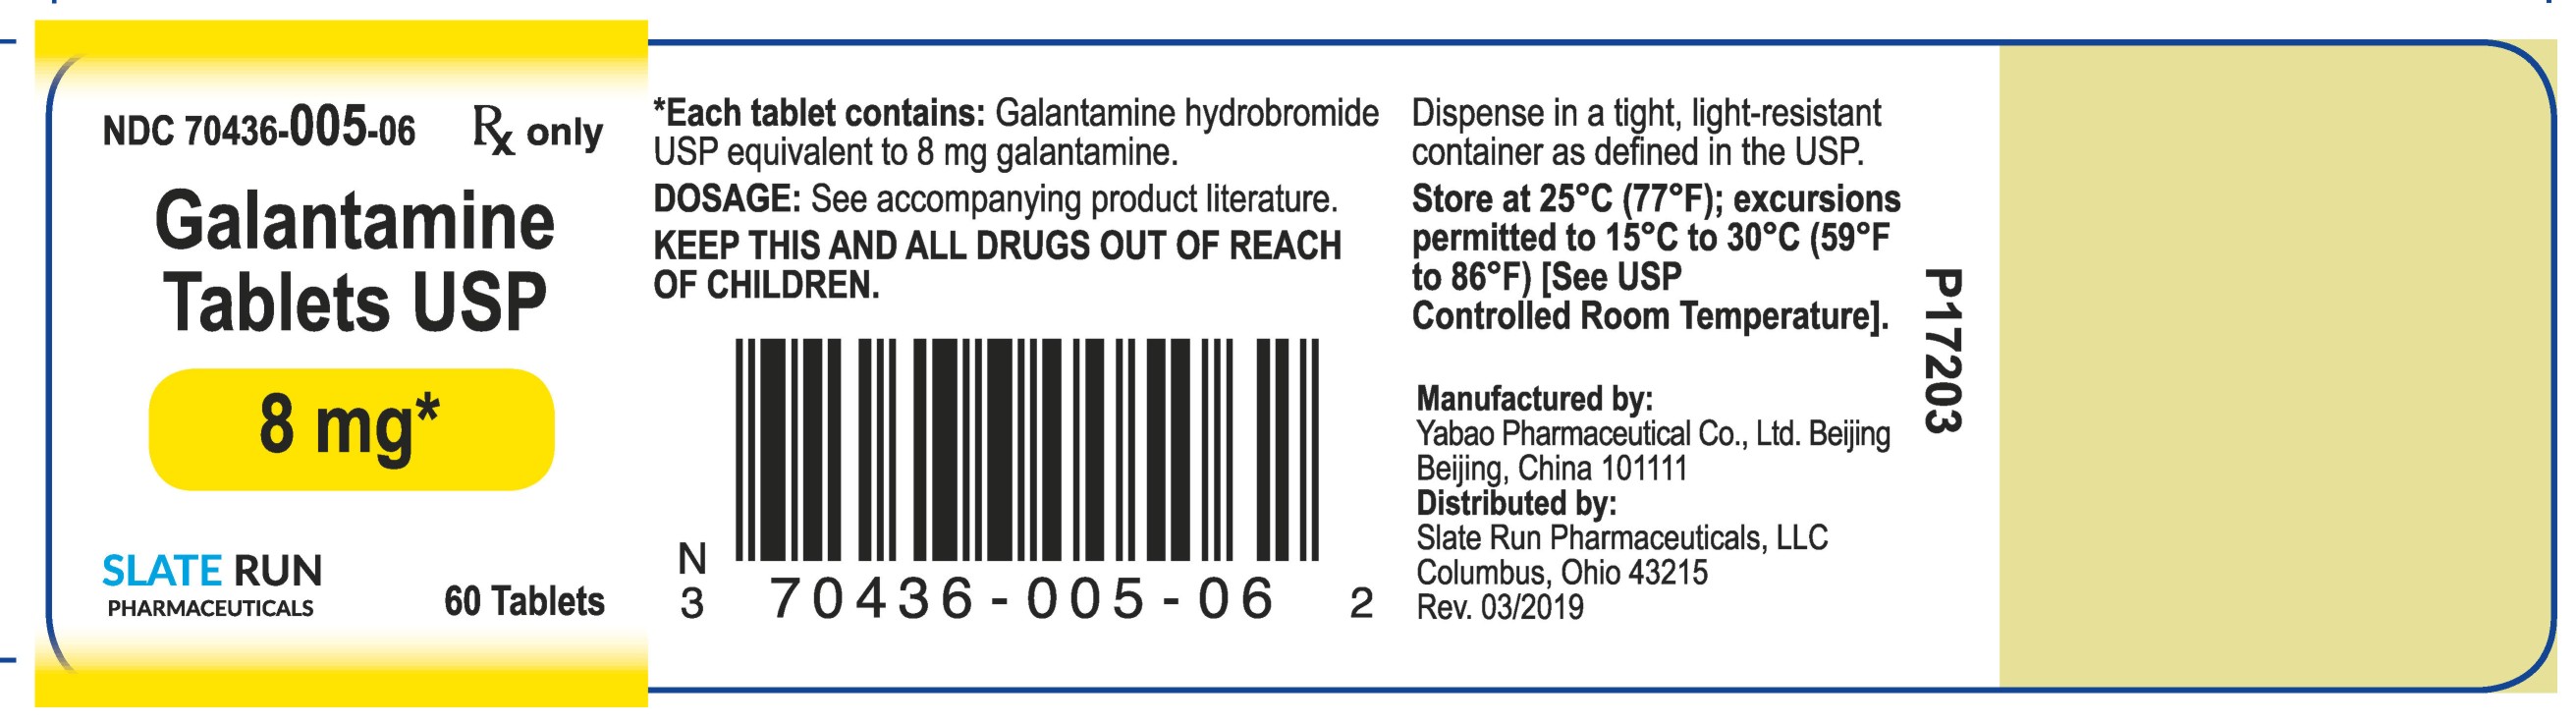
Galantamine 8mg 60 Container Label

Galantamine 8mg 60 Container Label
Galantamine Tablets USP 8 mg film-coated oral tablets label showing NDC 70436-005-06. Container holds 60 tablets. Manufactured by Yabao Pharmaceutical Co., Ltd., Beijing, China, and distributed by Slate Run Pharmaceuticals, LLC, Columbus, Ohio. The label includes storage instructions and dosage literature reference.*
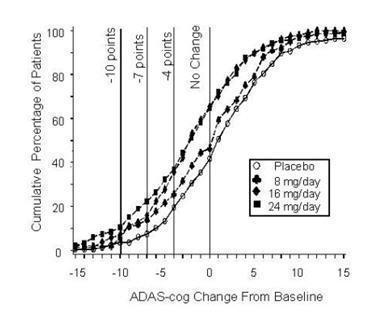
FDA Label Image

Galantamine03

Galantamine03
A cumulative percentage curve chart showing patient data with ADAS-cog change from baseline on the x-axis and cumulative percentage of patients on the y-axis. The graph compares placebo with galantamine doses of 8 mg/day, 16 mg/day, and 24 mg/day, illustrating shifts in cognitive scores across different dose groups.*

* About these descriptions: Image descriptions on this page are generated by automated AI analysis of the product label images from the manufacturer's FDA label submission (SPL). They are provided for reference only and may contain errors or omissions. Always rely on the printed label itself and the official FDA labeling, and consult a pharmacist or healthcare professional with any questions about this product.