Ganciclovir Sodium Injection, Powder, Lyophilized, For Solution
Product Images NDC 70436-231

View Photos of Packaging, Regulatory Labels, and Product Appearance

Product Visual Gallery

This gallery contains 6 technical images submitted to the FDA as part of the official labeling for Ganciclovir Sodium (NDC 70436-231). Unlike standard consumer photos, these assets often include clinical data figures, molecular chemical structures, and official manufacturer packaging layouts.

As provided by Slate Run Pharmaceuticals, Llc, these visuals offer a comprehensive scientific overview of the product's physical and chemical identity, aiding pharmacists and researchers in product verification and study.

FDA Label Image

T:\spl Documents\ganciclovir Injection-spl\chemical Structures.jpg (Chemical Structures)

T:\spl Documents\ganciclovir Injection-spl\chemical Structures.jpg (Chemical Structures)
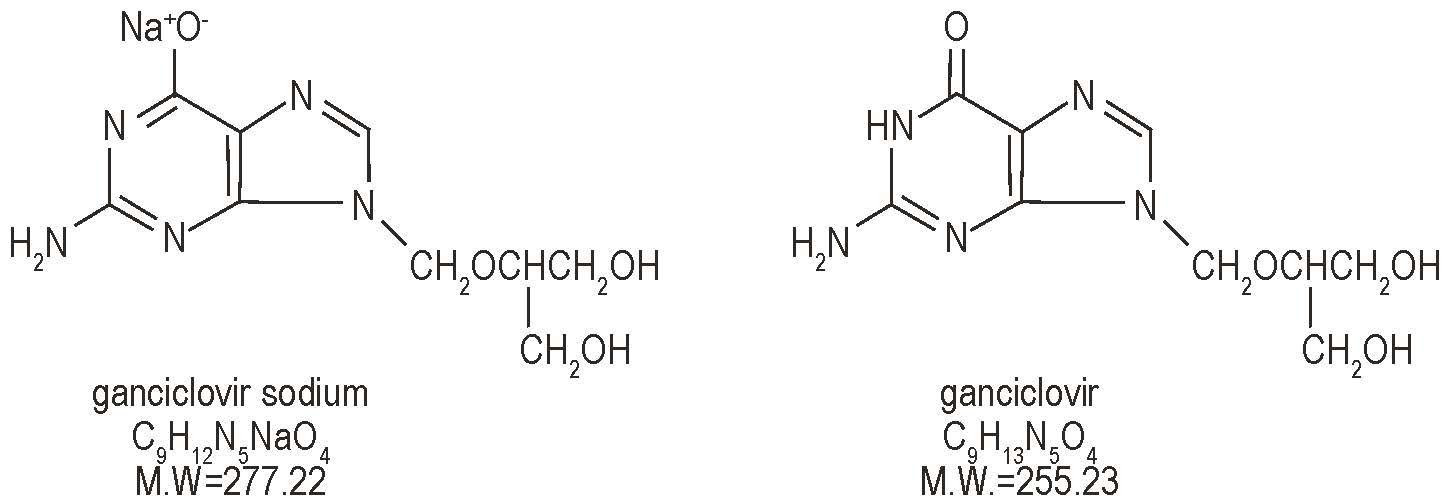
This is a chemical formula comparison between ganciclovir sodium and ganciclovir. Ganciclovir sodium has a molecular formula of C9H12N5NaO4 with a molecular weight of 277.22, while ganciclovir has a molecular formula of C9H13N5O4 with a molecular weight of 255.23.*
FDA Label Image

T:\spl Documents\ganciclovir Injection-spl\figure 1 Pan Black C.jpg (Figure 1 Pan Black C)

T:\spl Documents\ganciclovir Injection-spl\figure 1 Pan Black C.jpg (Figure 1 Pan Black C)
This text describes a graph showing the time to progression of Cytomegalovirus (CMV) retinitis in patients undergoing maintenance therapy. The x-axis represents the time in days from the start of maintenance therapy, while the y-axis depicts the proportion of patients without progression of retinitis.*
FDA Label Image

T:\spl Documents\ganciclovir Injection-spl\figure 2 Pan Black C.jpg (Figure 2 Pan Black C)

T:\spl Documents\ganciclovir Injection-spl\figure 2 Pan Black C.jpg (Figure 2 Pan Black C)
This data refers to the time to progression of CMV retinitis in patients undergoing maintenance therapy. The graph shows the proportion of patients without progression of the disease over time. The x-axis represents the days from the start of maintenance therapy, and the y-axis indicates the proportion of patients without progression.*
FDA Label Image

T:\spl Documents\ganciclovir Injection-spl\figure 3 Pan Black C.jpg (Figure 3 Pan Black C)

T:\spl Documents\ganciclovir Injection-spl\figure 3 Pan Black C.jpg (Figure 3 Pan Black C)
This text provides data on the time to progression of CMV retinitis. It shows a graph with the proportion of cases without progression over a period of 150 days since the start of maintenance therapy. The y-axis represents the proportion, while the x-axis shows the time in days.*
FDA Label Image

500 mg Vial (Image 01)

FDA Label Image

Novaplus Logo (Image 02)

* These product label images have been analyzed using experimental machine learning. Please verify findings with the primary label text.