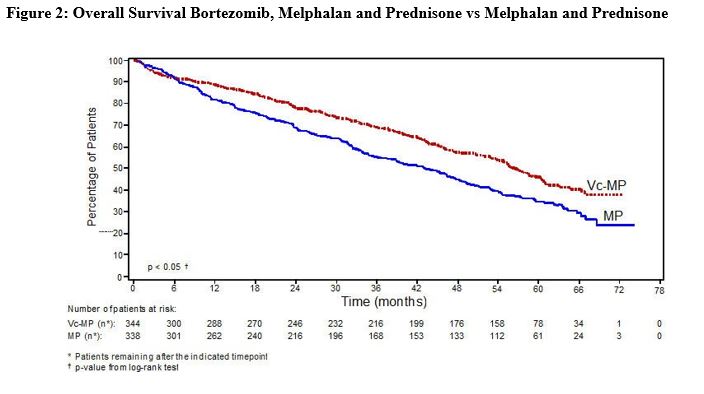
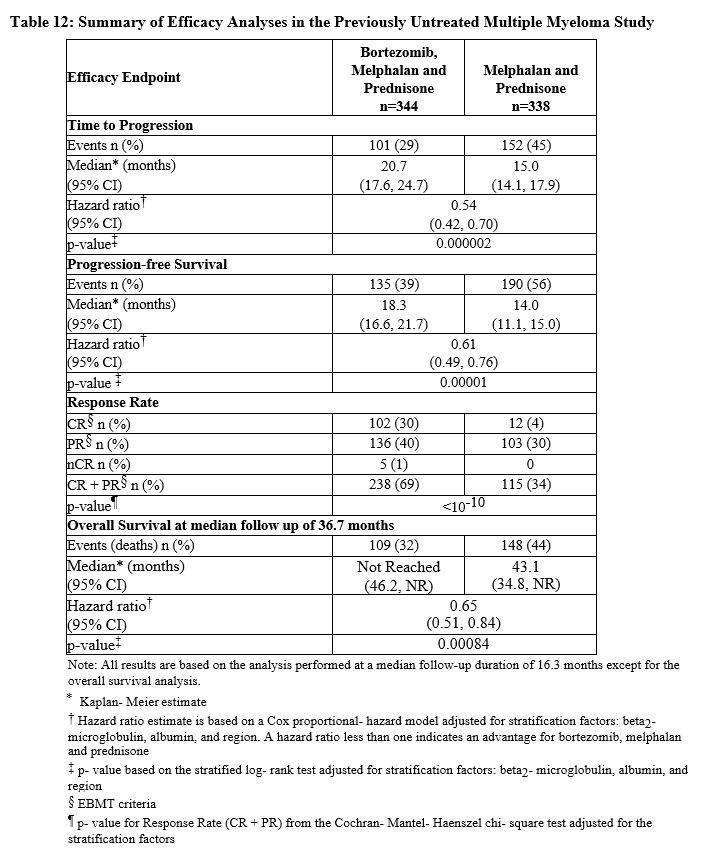
Figure 1 (Figure 1)

The figure shows a comparison of the time to progression between the treatment of Bortezomib, Melphalan, and Prednisone versus Melphalan and Prednisone. The X-axis represents time in months while the Y-axis shows the number of patients. The patients remaining after the indicated time point are marked with an asterisk. The results from the log-rank test are used to evaluate the significance between the two treatments.*