Irbesartan And Hydrochlorothiazide Tablet
Product Images NDC 70518-1550

View Photos of Packaging, Regulatory Labels, and Product Appearance

Product Visual Gallery

This gallery contains 9 technical images submitted to the FDA as part of the official labeling for Irbesartan And Hydrochlorothiazide (NDC 70518-1550). Unlike standard consumer photos, these assets often include clinical data figures, molecular chemical structures, and official manufacturer packaging layouts.

As provided by Remedyrepack Inc., these visuals offer a comprehensive scientific overview of the product's physical and chemical identity, aiding pharmacists and researchers in product verification and study.

FDA Label Image

Irbesartan And Hydrochlorothiazide Figure 1a (22bf08c2 615b 4b48 Af36 1b71a91459dc 01)
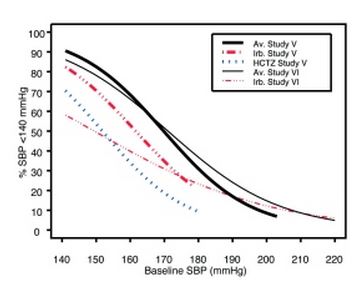
Irbesartan And Hydrochlorothiazide Figure 1a (22bf08c2 615b 4b48 Af36 1b71a91459dc 01)
A line graph displaying the relationship between baseline systolic blood pressure (SBP) in mmHg on the x-axis and the number of subjects with SBP less than 140 mmHg on the y-axis. The graph shows multiple study groups represented by different line styles and colors, comparing blood pressure changes across baseline SBP values.*
FDA Label Image

Irbesartan And Hydrochlorothiazide Figure 1b (22bf08c2 615b 4b48 Af36 1b71a91459dc 02)

Irbesartan And Hydrochlorothiazide Figure 1b (22bf08c2 615b 4b48 Af36 1b71a91459dc 02)
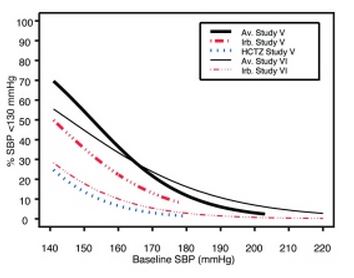
A line graph showing percentage of systolic blood pressure below 130 mmHg on the y-axis against baseline systolic blood pressure in mmHg on the x-axis. The chart compares multiple studies labeled as Av., Irb., HCTZ, and their combinations across two study groups, with trends showing a decrease in percentage as baseline SBP increases.*
FDA Label Image

Irbesartan And Hydrochlorothiazide Figure 2a (22bf08c2 615b 4b48 Af36 1b71a91459dc 03)

Irbesartan And Hydrochlorothiazide Figure 2a (22bf08c2 615b 4b48 Af36 1b71a91459dc 03)
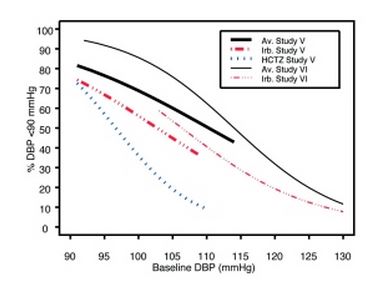
A line chart showing percent change in DBP (diastolic blood pressure) versus baseline DBP in mmHg. The chart includes multiple study groups labeled Study V and Study VI with lines for average, Irbesartan (Irb.), and Hydrochlorothiazide (HCTZ) responses.*
FDA Label Image

Irbesartan And Hydrochlorothiazide Figure 2b (22bf08c2 615b 4b48 Af36 1b71a91459dc 04)

Irbesartan And Hydrochlorothiazide Figure 2b (22bf08c2 615b 4b48 Af36 1b71a91459dc 04)
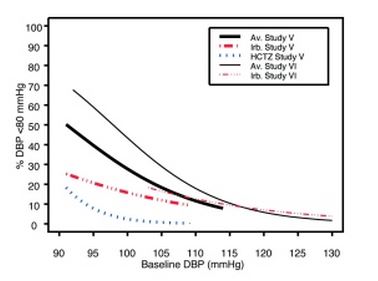
A line graph displaying the percentage change in diastolic blood pressure (% DBP <80 mmHg) relative to baseline diastolic blood pressure (DBP in mmHg). The graph compares data from different studies and treatments, including averages and specific treatments labeled as Study V and Study VI, with distinct line styles for each dataset.*
FDA Label Image

Chemical Structure Irbesartan (22bf08c2 615b 4b48 Af36 1b71a91459dc 05)

Chemical Structure Irbesartan (22bf08c2 615b 4b48 Af36 1b71a91459dc 05)
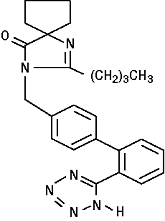
Chemical structure of Irbesartan and Hydrochlorothiazide active ingredients depicted with molecular bonding and ring formations.*
FDA Label Image

Chemical Structure Hydrochlorothiazide (22bf08c2 615b 4b48 Af36 1b71a91459dc 06)

Chemical Structure Hydrochlorothiazide (22bf08c2 615b 4b48 Af36 1b71a91459dc 06)
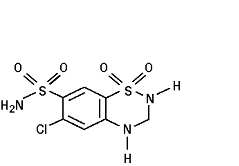
Chemical structure of Irbesartan and Hydrochlorothiazide, showing the molecular arrangement and atoms typical of these active ingredients in the medication.*
FDA Label Image

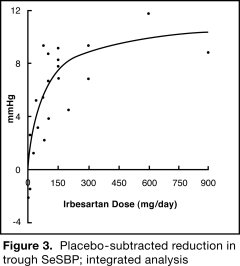
Irbesartan And Hydrochlorothiazide Figure 3 (22bf08c2 615b 4b48 Af36 1b71a91459dc 07)

Irbesartan And Hydrochlorothiazide Figure 3 (22bf08c2 615b 4b48 Af36 1b71a91459dc 07)
A scatter plot with a curve showing the placebo-subtracted reduction in trough SeSBP (systolic blood pressure) as a function of irbesartan dose (mg/day). The x-axis represents the irbesartan dose ranging from 0 to 900 mg/day, and the y-axis measures reduction in mmHg from -4 to 12 mmHg. Data points are scattered below and above the curve, which rises steeply then plateaus.*
FDA Label Image

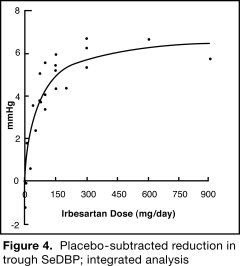
Irbesartan And Hydrochlorothiazide Figure 4 (22bf08c2 615b 4b48 Af36 1b71a91459dc 08)

Irbesartan And Hydrochlorothiazide Figure 4 (22bf08c2 615b 4b48 Af36 1b71a91459dc 08)
A scatter plot with a curve depicting the placebo-subtracted reduction in trough SeDBP (systolic blood pressure) as a function of Irbesartan dose in mg/day. The x-axis represents Irbesartan dose ranging from 0 to 900 mg/day, and the y-axis shows reduction in mmHg from -2 to 8 mmHg. Data points are scattered with a fitted nonlinear curve showing response trend.*
FDA Label Image

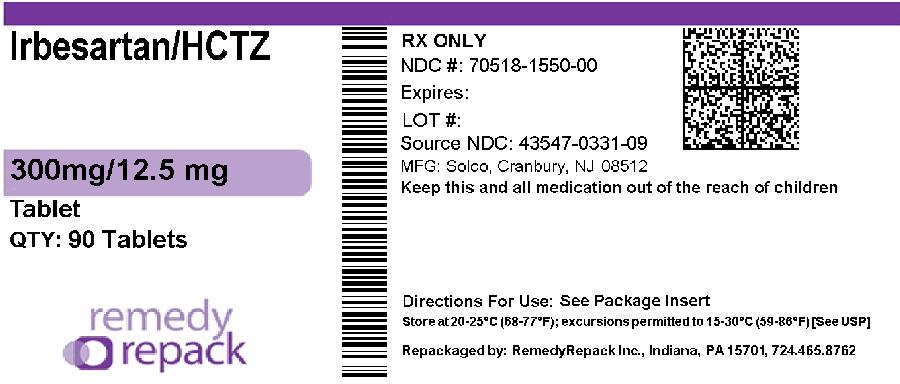
Remedy_label (Remedy Label)

Remedy_label (Remedy Label)
Packaging label for Irbesartan and Hydrochlorothiazide tablets, 300 mg/12.5 mg, oral dosage form. The label indicates a quantity of 90 tablets and is repackaged by RemedyRepack Inc. It includes barcode, NDC number 70518-1550-00, manufacturer information (Solco, Cranbury, NJ), and storage instructions.*

* About these descriptions: Image descriptions on this page are generated by automated AI analysis of the product label images from the manufacturer's FDA label submission (SPL). They are provided for reference only and may contain errors or omissions. Always rely on the printed label itself and the official FDA labeling, and consult a pharmacist or healthcare professional with any questions about this product.