Donepezil Hydrochloride Tablet, Film Coated
Product Images NDC 70518-1666

12 FDA label images from Remedyrepack Inc. · Packaging, Regulatory Labels, and Product Appearance

Product Visual Gallery

This gallery contains 12 technical images submitted to the FDA as part of the official labeling for Donepezil Hydrochloride (NDC 70518-1666). Unlike standard consumer photos, these assets often include clinical data figures, molecular chemical structures, and official manufacturer packaging layouts.

As provided by Remedyrepack Inc., these visuals offer a comprehensive scientific overview of the product's physical and chemical identity, aiding pharmacists and researchers in product verification and study.

FDA Label Image

Structural Formula (41d7651e B91a 4118 8719 Bf2f663d82a2 01)

Structural Formula (41d7651e B91a 4118 8719 Bf2f663d82a2 01)
Chemical structure of donepezil hydrochloride, illustrating its molecular framework including aromatic rings, methoxy groups, a piperidine ring, and the hydrochloride component as depicted in the image.*
FDA Label Image

Figure 1 (41d7651e B91a 4118 8719 Bf2f663d82a2 02)

Figure 1 (41d7651e B91a 4118 8719 Bf2f663d82a2 02)
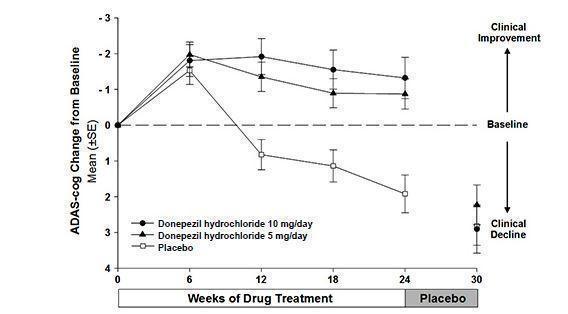
A line graph depicting ADAS-cog mean change from baseline over 30 weeks of drug treatment, comparing donepezil hydrochloride 10 mg/day, 5 mg/day, and placebo. The x-axis shows weeks of treatment, including a placebo phase after 24 weeks. The y-axis reflects cognitive change with clinical improvement above baseline and clinical decline below. Donepezil groups maintain improvement, while placebo shows decline.*
FDA Label Image

Figure 2 (41d7651e B91a 4118 8719 Bf2f663d82a2 03)

Figure 2 (41d7651e B91a 4118 8719 Bf2f663d82a2 03)
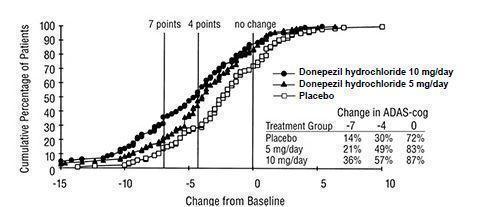
A cumulative percentage of patients line chart comparing changes from baseline in ADAS-cog scores for donepezil hydrochloride 10 mg/day, 5 mg/day, and placebo groups. The x-axis represents change from baseline, and the y-axis shows cumulative patient percentage. A table below the graph lists the percent of patients achieving minimum score changes at 7 points, 4 points, and no change for each treatment group.*
FDA Label Image

Figure 3 (41d7651e B91a 4118 8719 Bf2f663d82a2 04)

Figure 3 (41d7651e B91a 4118 8719 Bf2f663d82a2 04)
A bar chart comparing the percentage of patients by CIBIC-plus Rating categories for donepezil hydrochloride 10 mg/day, 5 mg/day, and placebo groups. The horizontal axis shows ratings from Markedly Improved to Markedly Worse. The vertical axis shows the percentage of patients from 0 to 50%. Different bars represent the three groups for each rating category.*
FDA Label Image

Figure 4 (41d7651e B91a 4118 8719 Bf2f663d82a2 05)

Figure 4 (41d7651e B91a 4118 8719 Bf2f663d82a2 05)
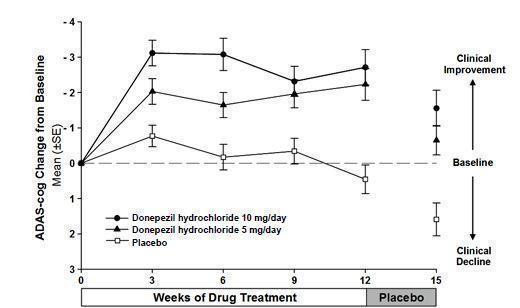
A line graph depicting the change from baseline in ADAS-cog scores over 15 weeks of drug treatment comparing donepezil hydrochloride 10 mg/day, 5 mg/day, and placebo. The vertical axis shows ADAS-cog mean changes, with clinical improvement above baseline and clinical decline below. The horizontal axis shows weeks of treatment followed by a placebo period. Error bars indicate standard error of the mean for each group.*
FDA Label Image

Figure 5 (41d7651e B91a 4118 8719 Bf2f663d82a2 06)

Figure 5 (41d7651e B91a 4118 8719 Bf2f663d82a2 06)
A line graph showing cumulative percentage of patients plotted against change from baseline in a clinical measure. Three groups are compared: donepezil hydrochloride 10 mg/day, donepezil hydrochloride 5 mg/day, and placebo. The graph includes marked points for statistical significance and a small table summarizing percentage changes in ADAS-cog scores for each treatment group.*
FDA Label Image

Figure 6 (41d7651e B91a 4118 8719 Bf2f663d82a2 07)

Figure 6 (41d7651e B91a 4118 8719 Bf2f663d82a2 07)
A bar chart showing the percentage of patients by CIBIC-plus rating categories comparing Aricept 10 mg/day, Aricept 5 mg/day, and placebo. Categories include Markedly Improved, Moderately Improved, Minimally Improved, No Change, Minimally Worse, Moderately Worse, and Markedly Worse, with respective patient percentages indicated on the vertical axis.*
FDA Label Image

Figure 7 (41d7651e B91a 4118 8719 Bf2f663d82a2 08)

Figure 7 (41d7651e B91a 4118 8719 Bf2f663d82a2 08)
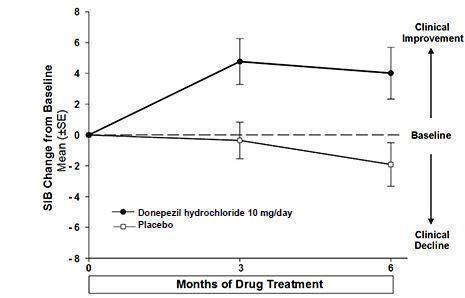
A line graph showing the change from baseline in SIB (Severe Impairment Battery) scores over 6 months of drug treatment. Two lines represent donepezil hydrochloride 10 mg/day and placebo groups. The graph indicates clinical improvement and decline with error bars at 3 and 6 months, comparing treatment effects over time.*
FDA Label Image

Figure 8 (41d7651e B91a 4118 8719 Bf2f663d82a2 09)

Figure 8 (41d7651e B91a 4118 8719 Bf2f663d82a2 09)
A cumulative percentage graph comparing donepezil hydrochloride 10 mg/day versus placebo on SIB (Severe Impairment Battery) change from baseline in patients. The x-axis represents SIB change from baseline, and the y-axis shows the cumulative percentage of patients. Two curves represent donepezil hydrochloride and placebo groups respectively.*
FDA Label Image

Figure 9 (41d7651e B91a 4118 8719 Bf2f663d82a2 10)

Figure 9 (41d7651e B91a 4118 8719 Bf2f663d82a2 10)
A line graph showing ADCS-ADL mean change from baseline with standard error over 6 months of drug treatment. Two groups are compared: donepezil hydrochloride 10 mg/day and placebo. The donepezil group exhibits less decline compared to placebo, which shows greater clinical decline by month 6. The y-axis indicates clinical improvement or decline relative to baseline, and the x-axis shows months of treatment.*
FDA Label Image

Figure 10 (41d7651e B91a 4118 8719 Bf2f663d82a2 11)

Figure 10 (41d7651e B91a 4118 8719 Bf2f663d82a2 11)
A cumulative percentage of patients chart comparing donepezil hydrochloride 10 mg/day to placebo. The x-axis shows ADCS-ADL change from baseline ranging from -20 to 20, and the y-axis shows cumulative percentage of patients from 0 to 100%. Donepezil patients have a higher cumulative percentage showing greater decline than placebo as visualized by two curves on the graph.*
FDA Label Image

Remedy_label (Remedy Label)

Remedy_label (Remedy Label)
Donepezil hydrochloride 10 mg film-coated tablets label showing quantity of 90 tablets. The label includes NDC number 70518-1666-00, manufacturer location in Cranbury, NJ by Solco, and repackager Remedy Repack Inc. Directions advise referring to the package insert. Storage conditions are specified. The label also features a QR code and a caution to keep medication out of reach of children.*

* About these descriptions: Image descriptions on this page are generated by automated AI analysis of the product label images from the manufacturer's FDA label submission (SPL). They are provided for reference only and may contain errors or omissions. Always rely on the printed label itself and the official FDA labeling, and consult a pharmacist or healthcare professional with any questions about this product.