Clopidogrel Tablet, Film Coated
Product Images NDC 70518-1898

View Photos of Packaging, Regulatory Labels, and Product Appearance

Product Visual Gallery

This gallery contains 10 technical images submitted to the FDA as part of the official labeling for Clopidogrel (NDC 70518-1898). Unlike standard consumer photos, these assets often include clinical data figures, molecular chemical structures, and official manufacturer packaging layouts.

As provided by Remedyrepack Inc., these visuals offer a comprehensive scientific overview of the product's physical and chemical identity, aiding pharmacists and researchers in product verification and study.

FDA Label Image

Remedy_label (Remedy Label)

Remedy_label (Remedy Label)
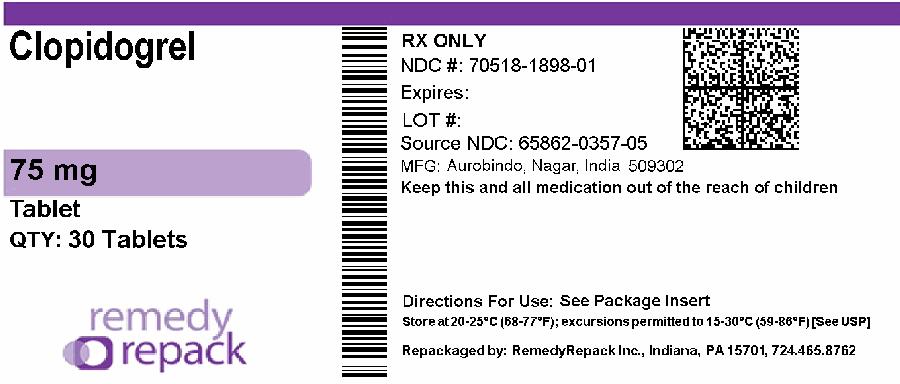
Clopidogrel is a medication available in tablet form, with 75mg strength in a package of 30 tablets. It is manufactured by Aurohindo in Nagar, India and repackaged by RemedyRepack Inc. in Indiana, PA. The medication should be stored at a temperature between 15-30°C (59-86°F). Further directions for use are available on the package insert, and the medication should be kept out of the reach of children.*
FDA Label Image

Figure 1 (Clopidogrel Fig1)

Figure 1 (Clopidogrel Fig1)
This is a graph labeled as Figure 1 that shows the effect of administering proton pump inhibitors (PPIs) on the exposure to Clopidogrel Active Metabolite following multiple doses of Clopidogrel Bisulfate 75mg alone. The graph depicts the mean and 90% confidence interval of the effect of co-administered PPIs on the active metabolite AUC. The PPIs mentioned in the graph are Dexlansoprazole, Lansoprazole, Pantoprazole, and Omeprazole. The change relative to Clopidogrel Bisulfate administered alone is also represented on the graph.*
FDA Label Image

Figure 2: Cardiovascular Death, Myocardial Infarction, And Stroke In The Cure Study (Clopidogrel Fig2)

Figure 2: Cardiovascular Death, Myocardial Infarction, And Stroke In The Cure Study (Clopidogrel Fig2)
This is a chart displaying the cumulative event rate for cardiovascular death, myocardial infarction, and stroke over 12 months of follow-up. Two treatments, Plagebo with aspirin and Clopidogrel Bisulfate with aspirin, are compared. Standard therapies were also used. The chart shows that Clopidogrel Bisulfate with aspirin has a significantly lower cumulative event rate compared to Plagebo with aspirin (P=0.00009).*
FDA Label Image

Figure-3 (Clopidogrel Fig3)

FDA Label Image

Figure 4: Cumulative Event Rates For Death In The Commit Study (Clopidogrel Fig4)

Figure 4: Cumulative Event Rates For Death In The Commit Study (Clopidogrel Fig4)
This is a comparative analysis of the effectiveness of placebo and clopidogrel in reducing the risk of death within 28 days of randomization. The percentage of deaths before the first discharge was 8.1% for placebo (1845 deaths) and 7.5% for clopidogrel (1726 deaths), representing a 7% proportional risk reduction with a p-value of 0.03. The data presents a graphical representation of the number of deaths in relation to the days since randomization.*
FDA Label Image

Figure 5: Cumulative Event Rates For The Combined Endpoint Re-infarction, Stroke Or Death In The Commit Study (Clopidogrel Fig5)

Figure 5: Cumulative Event Rates For The Combined Endpoint Re-infarction, Stroke Or Death In The Commit Study (Clopidogrel Fig5)
This text seems to be a table reporting the number of events with percentages for two different treatments or scenarios. The first one is called Placeb and the second one is Clopidogrel. Each treatment has a column with the number of events and their percentage, followed by a proportional risk and a percentage reduction with death, re-infarction, or stroke. The table also includes a timeline from 0 to 28 days since randomization. It is unclear what the events and treatments refer to without further context.*
FDA Label Image

Figure 6: Effects Of Adding Clopidogrel Bisulfate To Aspirin On The Combined Primary Endpoint Across Baseline And Concomitant Medication Subgroups For The Commit Study (Clopidogrel Fig6)

FDA Label Image

Figure 7: Fatal Or Non-fatal Vascular Events In The Caprie Study (Clopidogrel Fig7)

Figure 7: Fatal Or Non-fatal Vascular Events In The Caprie Study (Clopidogrel Fig7)
This appears to be a graph showing the cumulative event rates of fatal or non-fatal vascular events when taking aspirin and clopidogrel bisulfate over time. The x-axis measures the months of follow-up while the y-axis measures the cumulative event rate in percentages.*
FDA Label Image

Figure 8: Hazard Ratio And 95% Ci By Baseline Subgroups In The Caprie Study (Clopidogrel Fig8)

FDA Label Image

Chemical Structure (Clopidogrel Str)

* These product label images have been analyzed using experimental machine learning. Please verify findings with the primary label text.