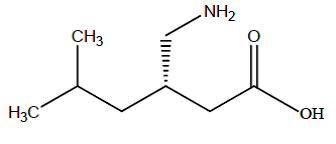
Pregabalin 75mg 70518 2525 00

This is a description of a medication named Pregabalin. The medication comes in a bottle with a National Drug Code number of 70518-2525-00 and contains 90 capsules of 75 milligrams each. The medication was manufactured by Novadoz Pharmaceuticals LLC in New Jersey, US. The lot number and expiration date are not available. The source NDC number is 72205-0013-90. The medication should be kept out of reach of children and stored in a cool and dry place at a temperature between 20-26°C (63-77°F), with excursions between 15-30°C (59-86°F). It is for Rx only and has been repackaged by RemedyRepack Inc. in Indiana, PA. *