Pregabalin Capsule
Product Images NDC 70518-2763

View Photos of Packaging, Regulatory Labels, and Product Appearance

Product Visual Gallery

This gallery contains 14 technical images submitted to the FDA as part of the official labeling for Pregabalin (NDC 70518-2763). Unlike standard consumer photos, these assets often include clinical data figures, molecular chemical structures, and official manufacturer packaging layouts.

As provided by Remedyrepack Inc., these visuals offer a comprehensive scientific overview of the product's physical and chemical identity, aiding pharmacists and researchers in product verification and study.

FDA Label Image

Remedy_label (Remedy Label)

Remedy_label (Remedy Label)
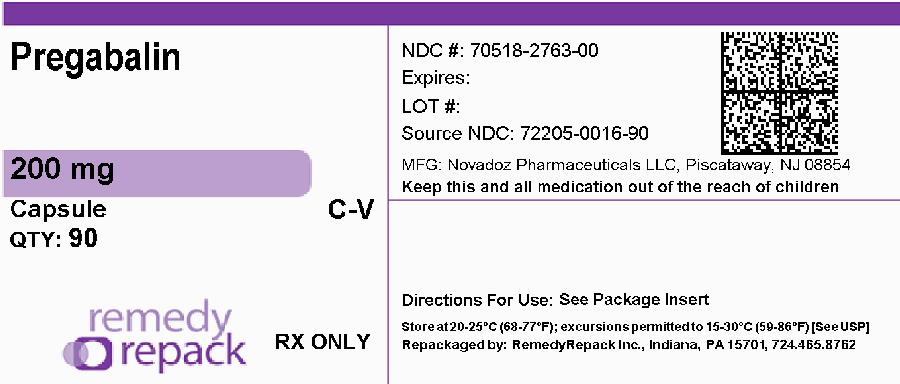
This is a description of a medication called Pregabalin. The medication is a 200mg capsule manufactured by Novadoz Pharmaceuticals LLC. It comes in a quantity of 90, and the National Drug Code (NDC) is 70518-2763-00. The expiration date and Lot number are not available. The medication should be stored between 20-26°C (63-77°F) with permitted excursions to 15-30°C (59-86°F). It is advised to keep medicine away from children. Additional information can be found in the package insert. This is a prescription-only medication that is repackaged by RemedyRepack Inc. in Indiana, PA.*
FDA Label Image

Equation (Pregabain Gault Equation)

Equation (Pregabain Gault Equation)
This text provides a formula to calculate CLCr, which stands for creatinine clearance, a measure of kidney function. The formula includes age, weight, and serum creatinine levels, with a different coefficient for female patients.*
FDA Label Image

Fig-01 (Pregabalin Figure 01)

Fig-01 (Pregabalin Figure 01)
The text describes the percent of patients who improved with various doses of Pregabalin and placebo. It also includes a graphical representation of the percent improvement in pain from baseline.*
FDA Label Image

Fig-02 (Pregabalin Figure 02)

Fig-02 (Pregabalin Figure 02)
This is a chart that displays the percentage of patients who improved while taking Pregabalin 100mg three times a day compared to a placebo. The chart represents the percentage of improvement in pain levels from baseline, with increments of 10%, going from 0 to 100%.*
FDA Label Image

Fig-03 (Pregabalin Figure 03)

Fig-03 (Pregabalin Figure 03)
This is a table that represents the percentage of patients improved using different doses of pregabalin and a placebo. The table also includes the percentage improvement in pain of the patients from the baseline.*
FDA Label Image

Fig-04 (Pregabalin Figure 04)

Fig-04 (Pregabalin Figure 04)
This appears to be a chart displaying the percentage of patients whose pain levels improved based on the dosage of Pregabalin taken. The X-axis shows the percentage improvement in pain from the baseline, while the Y-axis shows the percentage of patients who saw that level of improvement. There are three lines representing different dosages of Pregabalin as well as a placebo.*
FDA Label Image

Fig-05 (Pregabalin Figure 05)

Fig-05 (Pregabalin Figure 05)
This appears to be a chart or graph that shows the percentage of patients who experienced improvement in pain after taking either pregabalin 100mg three times a day, pregabalin 50mg three times a day, or a placebo. The chart also includes the percentage of improvement in pain from baseline.*
FDA Label Image

Fig-06 (Pregabalin Figure 06)

Fig-06 (Pregabalin Figure 06)
This appears to be a table of data regarding a study on a medication or treatment. The top row shows responder rates in percentages, with different dosages listed in the left column. The dosages include 50mg/day, 150mg/day, 300mg/day, and 600mg/day. In some cases, statistically significant improvements were observed compared to a placebo. There are also references to different studies labeled E1 and E3. However, there is not enough context to determine the specific treatment or condition being studied.*
FDA Label Image

Fig-07 (Pregabalin Figure 07)

FDA Label Image

Fig-09 (Pregabalin Figure 09)

Fig-09 (Pregabalin Figure 09)
This is a graph that shows the percent of patient improvement and the percent of improvement in pain from baseline. The graph includes four different doses of Pregabalin and a placebo. The x-axis displays the percent of improvement in pain from baseline ranging from 20 to 100 while the y-axis displays the percent of patient improvement ranging from 0 to 100.*
FDA Label Image

Fig-10 (Pregabalin Figure 10)

FDA Label Image

Fig-11 (Pregabalin Figure 11)

Fig-11 (Pregabalin Figure 11)
This is a chart that shows the percent of subjects improved from baseline to week 12. The chart compares the results between two groups, Pregabalin and Placebo. The X-axis shows percentage points from 0 to 100, and the Y-axis shows the percentage of subjects improved. It indicates that the Pregabalin group had higher percentages of improvement compared to the Placebo group.*
FDA Label Image

Fig-12 (Pregabalin Figure 12)

Fig-12 (Pregabalin Figure 12)
The text provided is a table showing the percentage of subjects who improved after taking Pregabalin or Placebo for 16 weeks. The table has different percentages ranging from 0 to 100 in increments of 10, and the number of subjects who improved at each percentage is indicated. There is no additional context to provide a more detailed description.*
FDA Label Image

Str (Pregabalin Structure)

* These product label images have been analyzed using experimental machine learning. Please verify findings with the primary label text.