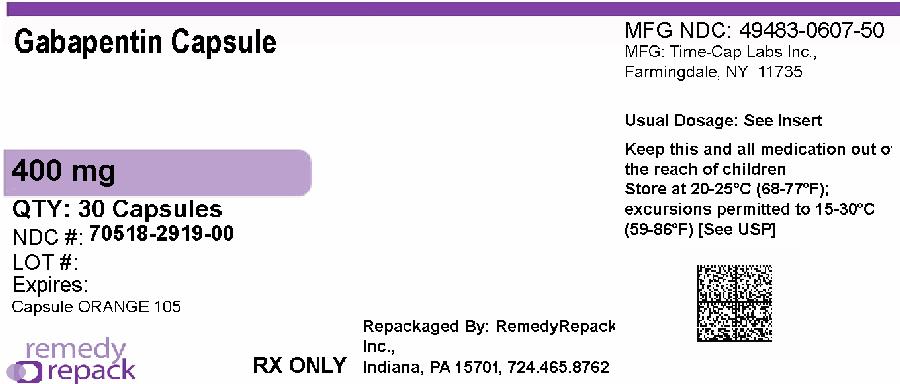
Gabapentin Capsule
Product Images NDC 70518-2919

8 FDA label images from Remedyrepack Inc. · Packaging, Regulatory Labels, and Product Appearance

Product Visual Gallery

This gallery contains 8 technical images submitted to the FDA as part of the official labeling for Gabapentin (NDC 70518-2919). Unlike standard consumer photos, these assets often include clinical data figures, molecular chemical structures, and official manufacturer packaging layouts.

As provided by Remedyrepack Inc., these visuals offer a comprehensive scientific overview of the product's physical and chemical identity, aiding pharmacists and researchers in product verification and study.

FDA Label Image

Formula (Gabapentin Figure 06)

Formula (Gabapentin Figure 06)
A formula illustrating the calculation of creatinine clearance (CLCr) based on age (years), weight (kg), serum creatinine (mg/dL), and a correction factor of 0.85 for female patients.*
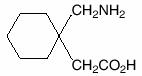
FDA Label Image

Structure Of Gaba (Gabapentin Figure 01)

Structure Of Gaba (Gabapentin Figure 01)
Chemical structure of gabapentin, showing a cyclohexane ring with amino and carboxyl functional groups attached.*
FDA Label Image

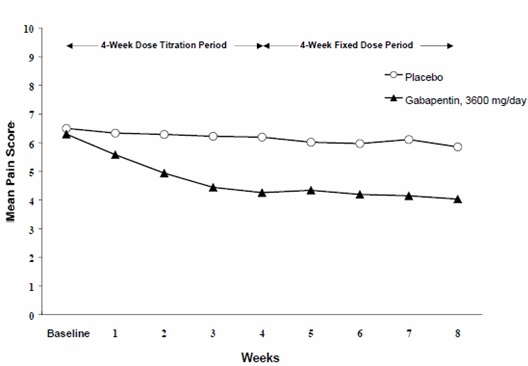
Figure-2 (Gabapentin Figure 02)

Figure-2 (Gabapentin Figure 02)
A line graph showing mean pain scores over an 8-week period comparing placebo and gabapentin 3600 mg/day. The x-axis represents weeks with a 4-week dose titration period followed by a 4-week fixed dose period. The y-axis shows the mean pain score, where gabapentin's scores decrease over time compared to placebo, which remains relatively constant.*
FDA Label Image

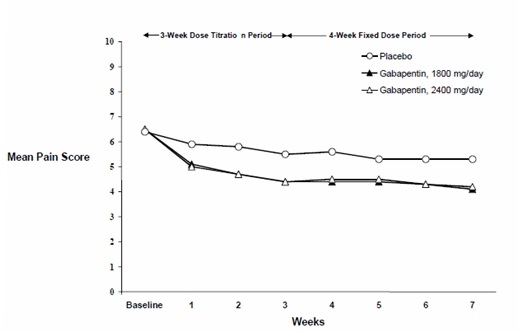
Figure-3 (Gabapentin Figure 03)

Figure-3 (Gabapentin Figure 03)
Line graph showing mean pain scores over a period of 7 weeks comparing placebo, gabapentin 1800 mg/day, and gabapentin 2400 mg/day. The graph includes a 3-week dose titration period followed by a 4-week fixed dose period, with mean pain scores plotted on the vertical axis and weeks on the horizontal axis.*
FDA Label Image

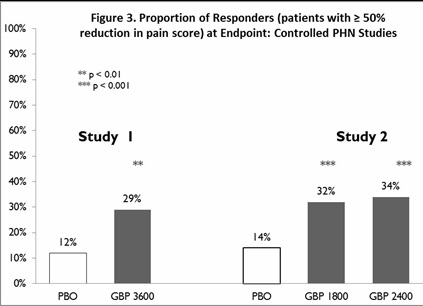
Figure-4 (Gabapentin Figure 04)

Figure-4 (Gabapentin Figure 04)
A bar chart titled 'Figure 3. Proportion of Responders (patients with ≥ 50% reduction in pain score) at Endpoint: Controlled PHN Studies' comparing proportions for two studies. It shows responder percentages for placebo (PBO) and gabapentin (GBP) at various dosages, with significant increases in responders for gabapentin groups at 3600 mg, 1800 mg, and 2400 mg compared to placebo.*
FDA Label Image

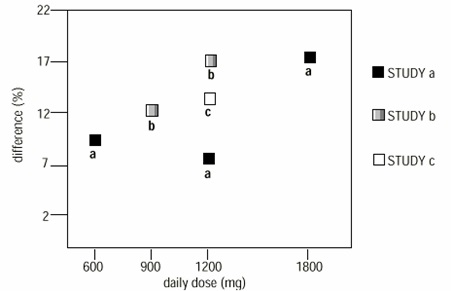
Image (Gabapentin Figure 05)

Image (Gabapentin Figure 05)
A scatter plot chart comparing the percentage difference against daily dose (mg) for three studies labeled as study a, study b, and study c. The x-axis represents daily doses ranging from 600 mg to 1800 mg, and the y-axis represents percentage difference values from 2% to 22%. Data points for each study are shown with distinct square markers in black, grey, and white.*
FDA Label Image

Mm1 (Gabapentin 400mg 70518 2919 00)

Mm1 (Gabapentin 400mg 70518 2919 00)
Gabapentin Capsule 400 mg oral capsules, qty 30, repackaged by RemedyRepack Inc. The label includes storage instructions and manufacturer details for Time-Cap Labs Inc., Farmingdale, NY. The capsules are orange, identified as Capsule ORANGE 105.*
FDA Label Image

Remedy_label (Remedy Label)

Remedy_label (Remedy Label)
Label for Gabapentin 400 mg capsules, quantity 30, repackaged by RemedyRepack Inc. The label includes the NDC number 70518-2919-00, manufacturer Time-Cap Labs Inc., Farmingdale, NY, and storage instructions. It states the product is RX only and advises to see the package insert for directions for use.*

* About these descriptions: Image descriptions on this page are generated by automated AI analysis of the product label images from the manufacturer's FDA label submission (SPL). They are provided for reference only and may contain errors or omissions. Always rely on the printed label itself and the official FDA labeling, and consult a pharmacist or healthcare professional with any questions about this product.