Product Images Pregabalin

View Photos of Packaging, Labels & Appearance

Product Label Images

The following 14 images provide visual information about the product associated with Pregabalin NDC 70518-3346 by Remedyrepack Inc., such as packaging, labeling, and the appearance of the drug itself. This resource could be helpful for medical professionals, pharmacists, and patients seeking to verify medication information and ensure they have the correct product.

Remedy_Label - Remedy Label

Remedy_Label - Remedy Label

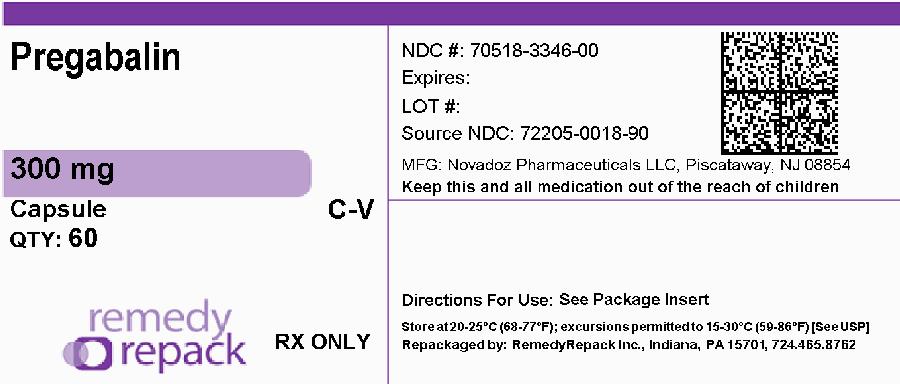
This is a description of a medication labeled as Pregabalin with a National Drug Code (NDC) number of 70518-3346-00. The medication comes in a capsule form with a strength of 300 mg and is manufactured by Novadoz Pharmaceuticals LLC in New Jersey. The package contains 60 capsules, and the directions for use can be found in the package insert. The medication has a Lot number and an expiry date. It should be stored at a temperature between 20-26°C (63-77°F) with some excursions permitted to 15-30°C (59-86°F) as per USP standards. The label also includes a warning to keep this and all medication out of the reach of children. The medication is for repackaging only and repackaged by RemedyRepack Inc in Indiana, PA.*

equation - pregabain gault equation

equation - pregabain gault equation

This appears to be a formula for calculating the Estimated Creatinine Clearance (CLCr), which is a measure of kidney function. The formula takes into account the patient's age, weight, and serum creatinine level. There is also a correction factor for female patients. However, there is a typo in the formula ("weignt" instead of "weight"), which may affect its accuracy.*

fig-01 - pregabalin figure 01

fig-01 - pregabalin figure 01

This text represents the percentage of patients who improved under different doses of Pregabalin and Placebo. It also denotes the percentage improvement in pain from the Baseline.*

fig-02 - pregabalin figure 02

fig-02 - pregabalin figure 02

This is a graph showing the percentage of patients who improved and the percentage of pain improvement using Pregabalin 100 mg three times a day and Placebo. The horizontal axis shows the percentages ranging from 10 to 100, and the vertical axis shows the percentage of pain improvement. The graph indicates that a higher percentage of patients improved when taking Pregabalin compared to Placebo.*

fig-03 - pregabalin figure 03

fig-03 - pregabalin figure 03

fig-04 - pregabalin figure 04

fig-04 - pregabalin figure 04

This text displays the effectiveness of Pregabalin in terms of pain reduction among patients. It shows the percentage of patients who experienced improvement in their condition when taking Pregabalin in different dosages, as well as a placebo group. The chart displays the percentage improvement in pain from a baseline, ranging from 10% to 100%.*

fig-05 - pregabalin figure 05

fig-05 - pregabalin figure 05

This is a chart showing the percentage of patients who showed improvement in pain after taking either pregabalin (dosages of 50mg or 100 mg taken three times a day) or a placebo. The chart also shows the percentage of improvement in pain from baseline, ranging from 10% to 90%.*

fig-06 - pregabalin figure 06

fig-06 - pregabalin figure 06

This appears to be a table with different values related to responder rates (%), two different studies (E1 and E3) and different dosages (50mgday, 150 mgday, 300 mg day and 600 mg day) for a placebo and medication. The table also indicates statistically significant results for some of the dosages.*

fig-07 - pregabalin figure 07

fig-07 - pregabalin figure 07

fig-09 - pregabalin figure 09

fig-09 - pregabalin figure 09

This is a graph displaying the percentage of patients who improved after taking Pregabalin at daily doses of 600mg, 450mg, and 300mg, as well as a placebo. The x-axis represents the percentage improvement in pain from baseline, while the y-axis shows the percentage of patients that improved. There are also some numbers listed near the y-axis, including 100, 80, 70, and 60.*

fig-10 - pregabalin figure 10

fig-10 - pregabalin figure 10

This is a graph displaying the estimated percentage of subjects without LIR (Likely Inadequate Response) over time for Pregabalin and Placebo. The X-axis represents time in days, while the Y-axis corresponds to the percentage of subjects without LIR, ranging from 0% to 100%. The data points are represented for time intervals of 20 days until day 180.*

fig-11 - pregabalin figure 11

fig-11 - pregabalin figure 11

This is a graph or chart showing the percent improvement of subjects from baseline to week 12 for Pregabalin and Placebo. The graph ranges from 0 to 100 in 10 percent increments. The percent improved for Pregabalin is not provided, but the graph shows that 100% of the subjects improved while on Pregabalin.*

fig-12 - pregabalin figure 12

fig-12 - pregabalin figure 12

This table displays the percentage of subjects who improved from baseline to week 16 for Pregabalin and Placebo. The improvement percentages are shown in increments of 10% starting from 0% to 100%. However, the accuracy and completeness of this description may be limited by the minimal context offered in the provided text segment.*

str - pregabalin structure

str - pregabalin structure

* The product label images have been analyzed using a combination of traditional computing and machine learning techniques. It should be noted that the descriptions provided may not be entirely accurate as they are experimental in nature. Use the information in this page at your own discretion and risk.