Sildenafil Tablet
Product Images NDC 70518-3433

View Photos of Packaging, Regulatory Labels, and Product Appearance

Product Visual Gallery

This gallery contains 11 technical images submitted to the FDA as part of the official labeling for Sildenafil (NDC 70518-3433). Unlike standard consumer photos, these assets often include clinical data figures, molecular chemical structures, and official manufacturer packaging layouts.

As provided by Remedyrepack Inc., these visuals offer a comprehensive scientific overview of the product's physical and chemical identity, aiding pharmacists and researchers in product verification and study.

FDA Label Image

Remedy_label (Remedy Label)
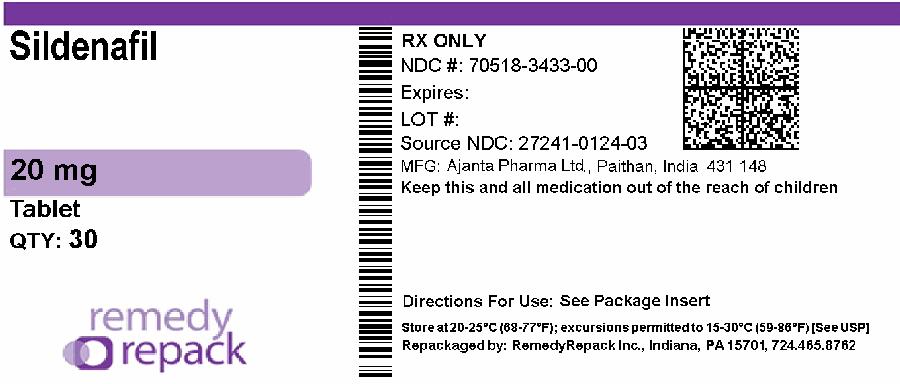
Remedy_label (Remedy Label)
Sildenafil 20 mg tablet label showing the quantity of 30 tablets. The label includes the NDC number 70518-3433-00, manufacturer information as Ajanta Pharma Ltd., India, and repackaging by RemedyRepack Inc. The label also advises keeping the medication out of children’s reach and refers to the package insert for directions.*
FDA Label Image

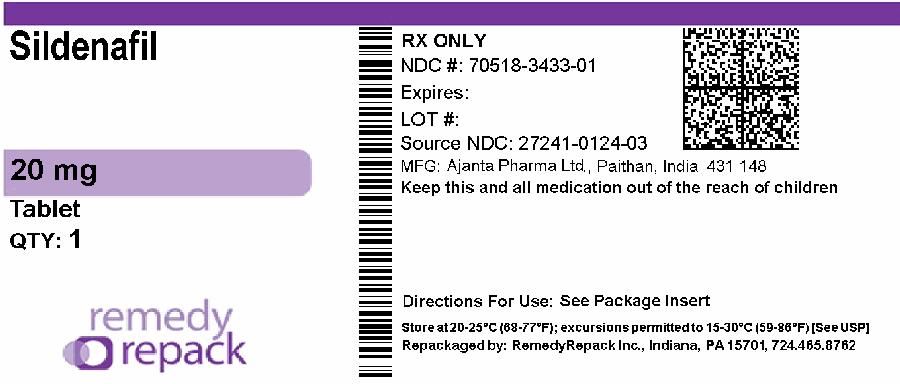
Mm2 (Sildenafil 20mg 70518 3433 01)

Mm2 (Sildenafil 20mg 70518 3433 01)
Packaging label for Sildenafil 20 mg oral tablet by RemedyRepack Inc. The label indicates a quantity of 1 tablet. It includes prescription drug information such as NDC 70518-3433-01, manufacturer Ajanta Pharma Ltd. in India, and directions to see the package insert. Storage conditions and repackaging details are also noted.*
FDA Label Image

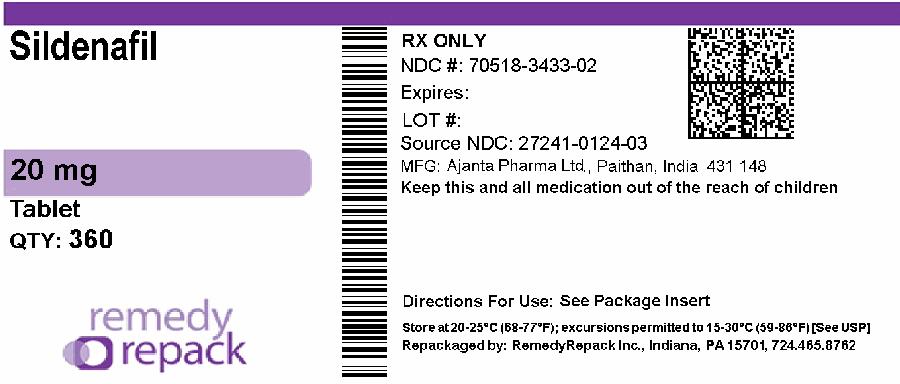
Sildenafil 20mg 70518 3433 02

Sildenafil 20mg 70518 3433 02
Sildenafil 20 mg tablet label showing a quantity of 360 tablets. The label includes the barcode, pharmacy information, and cautions to keep medication out of reach of children. It specifies repackaging by RemedyRepack Inc. and lists storage conditions.*
FDA Label Image

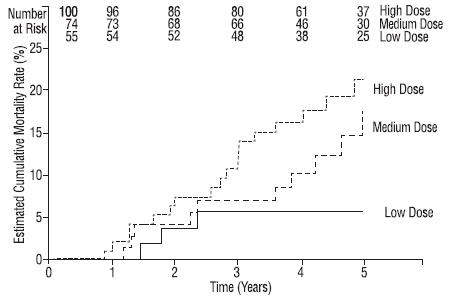
Figure1 (Sildenafil Figure 1)

Figure1 (Sildenafil Figure 1)
A line graph showing estimated cumulative mortality rate (%) over time (years) for three dosage levels labeled High Dose, Medium Dose, and Low Dose. The graph includes stepwise increases in mortality rates, with the High Dose exhibiting the highest rate, followed by Medium and Low Dose. The number of subjects at risk for each time point is displayed above the graph for all three dose groups.*
FDA Label Image

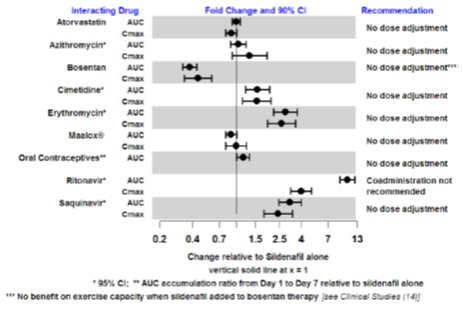
Sildenafil_fig2 (Sildenafil Figure 2)

Sildenafil_fig2 (Sildenafil Figure 2)
A forest plot chart showing fold change and 90% confidence intervals for various interacting drugs relative to Sildenafil alone. The chart displays changes in AUC and Cmax for drugs like Atorvastatin, Azithromycin, Bosentan, Cimetidine, Erythromycin, Maalox, Oral Contraceptives, Ritonavir, and Saquinavir, along with dosing recommendations such as no dose adjustment or coordination cautions.*
FDA Label Image

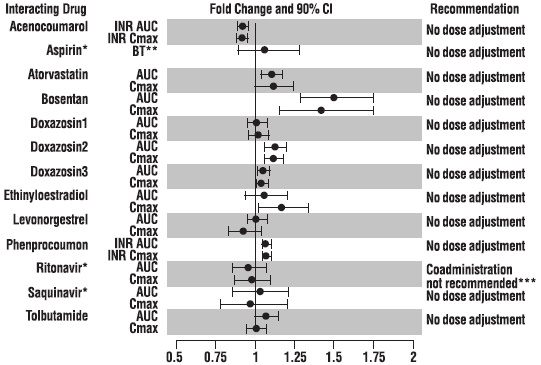
Figure3 (Sildenafil Figure 3)

Figure3 (Sildenafil Figure 3)
A chart depicting fold change with 90% confidence intervals for pharmacokinetic parameters (INR, AUC, Cmax, BT) of Sildenafil when coadministered with various interacting drugs. The chart includes recommendations whether dose adjustment is needed, mostly indicating no dose adjustment except for Ritonavir where coadministration is not recommended.*
FDA Label Image

Figure4 (Sildenafil Figure 4)

Figure4 (Sildenafil Figure 4)
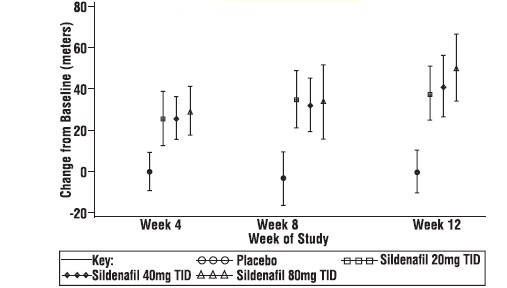
A line graph showing changes from baseline in meters over 12 weeks of study for three groups: Placebo, Sildenafil 20 mg TID, and Sildenafil 80 mg TID. Data points are plotted at weeks 4, 8, and 12 with variability indicated by error bars, illustrating dose-dependent effects of Sildenafil doses compared to placebo.*
FDA Label Image

Figure5 (Sildenafil Figure 5)

Figure5 (Sildenafil Figure 5)
A horizontal forest plot chart showing placebo-corrected changes in 6-minute walk distance (meters) for Sildenafil 20 mg TID across various subgroups including baseline walk distance, etiology of pulmonary arterial hypertension (PAH), functional class, gender, age, mean pulmonary arterial pressure (PAP), and pulmonary vascular resistance index (PVRI). Each subgroup is represented by a point estimate with confidence intervals comparing Sildenafil and placebo groups.*
FDA Label Image

Figure6 (Sildenafil Figure 6)

Figure6 (Sildenafil Figure 6)
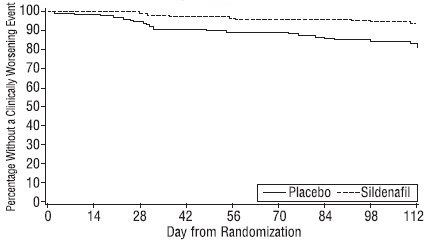
A Kaplan-Meier survival curve chart showing the percentage of subjects without a clinically worsening event over time (days from randomization) comparing Sildenafil and placebo groups. The graph depicts a higher percentage in the Sildenafil group over the 112-day period.*
FDA Label Image

Sildenafil-figure-7 (Sildenafil Figure 7)

Sildenafil-figure-7 (Sildenafil Figure 7)
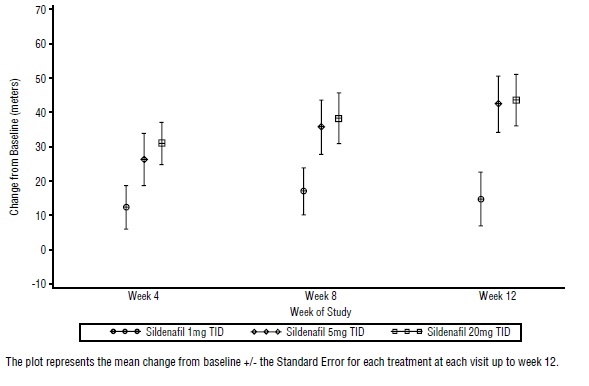
A line plot showing mean change from baseline in meters over weeks of study (4, 8, and 12) comparing Sildenafil dosed at 1 mg, 5 mg, and 20 mg TID. Data points include error bars representing standard error for each treatment at each visit up to week 12.*
FDA Label Image

Structure (Sildenafil Structure)

Structure (Sildenafil Structure)
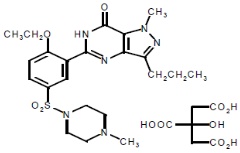
Chemical structure of sildenafil, showing its molecular framework with labeled rings and functional groups as consistent with the active ingredient sildenafil.*

* About these descriptions: Image descriptions on this page are generated by automated AI analysis of the product label images from the manufacturer's FDA label submission (SPL). They are provided for reference only and may contain errors or omissions. Always rely on the printed label itself and the official FDA labeling, and consult a pharmacist or healthcare professional with any questions about this product.