Divalproex Sodium Tablet, Extended Release
Product Images NDC 70518-3477

View Photos of Packaging, Regulatory Labels, and Product Appearance

Product Visual Gallery

This gallery contains 5 technical images submitted to the FDA as part of the official labeling for Divalproex Sodium (NDC 70518-3477). Unlike standard consumer photos, these assets often include clinical data figures, molecular chemical structures, and official manufacturer packaging layouts.

As provided by Remedyrepack Inc., these visuals offer a comprehensive scientific overview of the product's physical and chemical identity, aiding pharmacists and researchers in product verification and study.

FDA Label Image

Remedy_label (Remedy Label)

Remedy_label (Remedy Label)
Divalproex Sodium 500 mg extended-release oral tablets, 30 count, repackaged by RemedyRepack Inc. The label includes directions to see the package insert and storage instructions. The original manufacturer is Lupin Pharma, Baltimore, MD.*
FDA Label Image

Image 1 (D95f9b1b F1e4 4ae4 A215 7317fb1ca565 01)

Image 1 (D95f9b1b F1e4 4ae4 A215 7317fb1ca565 01)
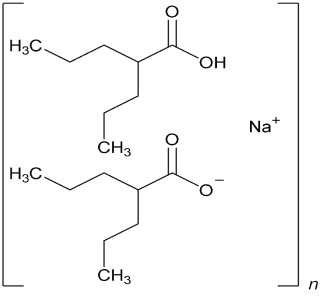
Chemical structure of Divalproex sodium, showing the molecular arrangement of its components including sodium ion (Na+).*
FDA Label Image

Image 2 (D95f9b1b F1e4 4ae4 A215 7317fb1ca565 02)

Image 2 (D95f9b1b F1e4 4ae4 A215 7317fb1ca565 02)
A cumulative percentage graph comparing the percent reduction in CPS (Clinical Parameter Score) rate between Divalproex Sodium Delayed-Release and placebo groups. The x-axis represents the percent of patients, ranging from 0 to 100%, while the y-axis shows percent reduction in CPS rate from -100% to 100%, with indications for improvement, no change, and worsening on the right side.*
FDA Label Image

Image 3 (D95f9b1b F1e4 4ae4 A215 7317fb1ca565 03)

Image 3 (D95f9b1b F1e4 4ae4 A215 7317fb1ca565 03)
A line graph depicting the percentage reduction in CPS rate among patients treated with high dose and low dose Divalproex Sodium delayed-release tablets. The x-axis represents the percentage of patients from 0 to 100, and the y-axis represents the percentage reduction in CPS rate from -100% to 100%. The graph shows improvement or worsening in CPS rate, with separate lines for high dose (solid) and low dose (dashed) treatments.*
FDA Label Image

Image 4 (D95f9b1b F1e4 4ae4 A215 7317fb1ca565 04)

Image 4 (D95f9b1b F1e4 4ae4 A215 7317fb1ca565 04)
A bar chart comparing two groups: placebo and Divalproex Sodium Extended-Release Tablets. The placebo group has a value of 0.6, while the Divalproex Sodium group shows a higher value of 1.2. The chart includes a statistical significance mark with a p-value of 0.006.*

* About these descriptions: Image descriptions on this page are generated by automated AI analysis of the product label images from the manufacturer's FDA label submission (SPL). They are provided for reference only and may contain errors or omissions. Always rely on the printed label itself and the official FDA labeling, and consult a pharmacist or healthcare professional with any questions about this product.