Losartan Potassium Tablet, Film Coated
Product Images NDC 70518-3489

View Photos of Packaging, Regulatory Labels, and Product Appearance

Product Visual Gallery

This gallery contains 6 technical images submitted to the FDA as part of the official labeling for Losartan Potassium (NDC 70518-3489). Unlike standard consumer photos, these assets often include clinical data figures, molecular chemical structures, and official manufacturer packaging layouts.

As provided by Remedyrepack Inc., these visuals offer a comprehensive scientific overview of the product's physical and chemical identity, aiding pharmacists and researchers in product verification and study.

FDA Label Image

Remedy_label (Remedy Label)
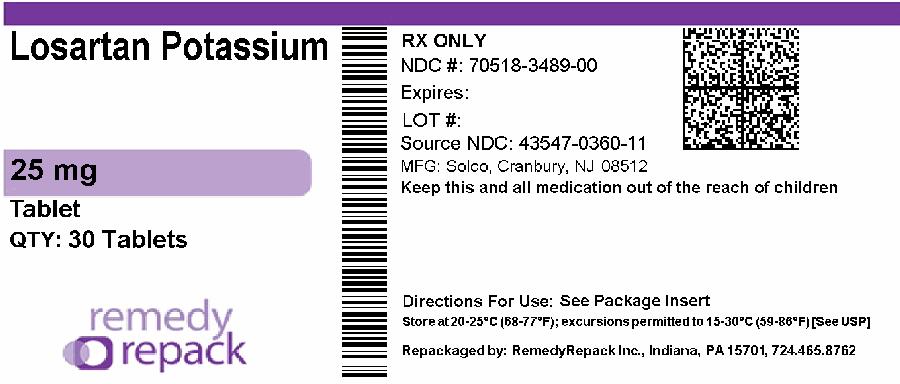
Remedy_label (Remedy Label)
Losartan Potassium 25 mg film-coated tablets label showing the product strength and dosage form with a quantity of 30 tablets. The label includes the National Drug Code (70518-3489-00), manufacturer information (Salco, Cranbury, NJ), and repackager details (RemedyRepack Inc., Indiana, PA). The label displays storage instructions and a QR code.*
FDA Label Image

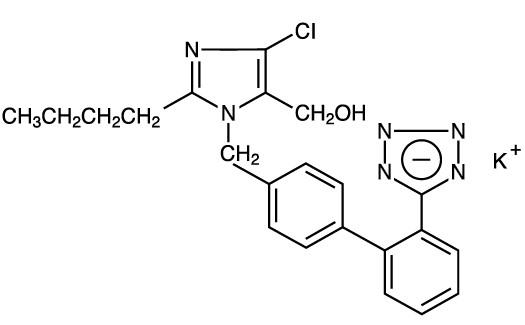
Chemical Structure (Spl Image1 Structure1)

Chemical Structure (Spl Image1 Structure1)
Chemical structure of Losartan Potassium, showing the arrangement of atoms including a chlorinated pyrimidine ring, biphenyl group, and potassium ion.*
FDA Label Image

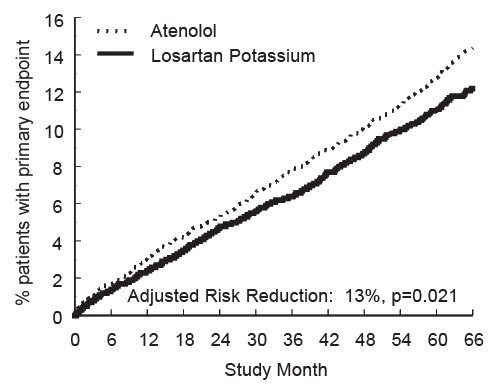
Figure 1 (Spl Image2 Figure1)

Figure 1 (Spl Image2 Figure1)
A line chart comparing the percentage of patients with primary endpoint events over study months for Atenolol (dotted line) and Losartan Potassium (solid line). The graph shows cumulative events from 0 to approximately 65 months, indicating a 13% adjusted risk reduction for Losartan Potassium with a p-value of 0.021.*
FDA Label Image

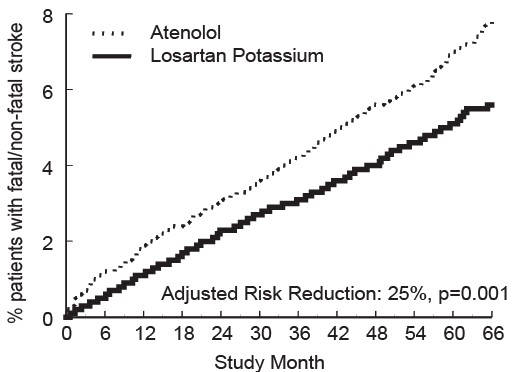
Figure 2 (Spl Image3 Figure2)

Figure 2 (Spl Image3 Figure2)
A line graph comparing the percentage of patients with fatal or non-fatal stroke over 66 study months for Atenolol (dotted line) and Losartan Potassium (solid line). The graph shows a 25% adjusted risk reduction for Losartan Potassium with a p-value of 0.001.*
FDA Label Image

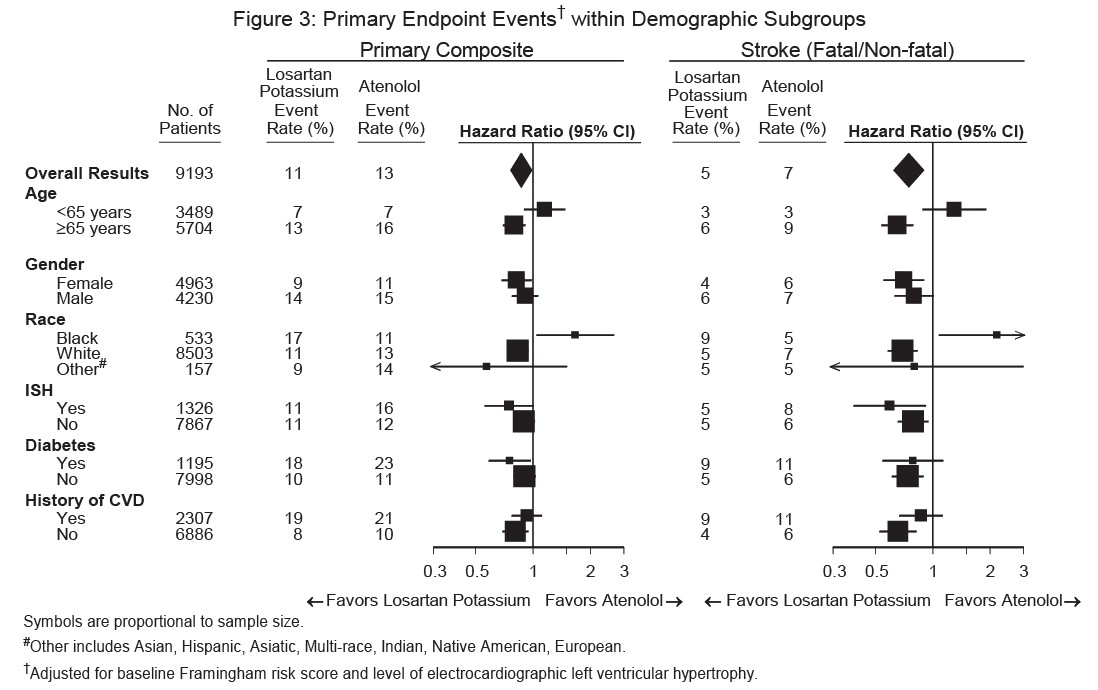
Figure 3 (Spl Image4 Figure3)

Figure 3 (Spl Image4 Figure3)
A forest plot chart titled 'Primary Endpoint Events within Demographic Subgroups' comparing Losartan Potassium versus Atenolol regarding primary composite events and stroke rates. The chart presents hazard ratios with 95% confidence intervals across subgroups including age, gender, race, isolated systolic hypertension (ISH), diabetes, and history of cardiovascular disease (CVD). The plot visually indicates which treatment is favored within each subgroup by showing event rates and confidence intervals.*
FDA Label Image

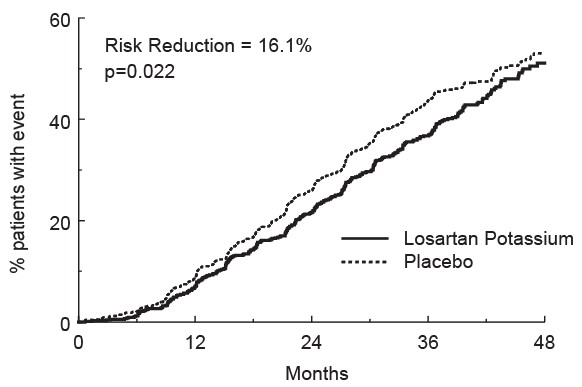
Figure 4 (Spl Image5 Figure4)

Figure 4 (Spl Image5 Figure4)
A line graph comparing the percentage of patients with an event over 48 months between Losartan Potassium and placebo groups. The y-axis shows % patients with event from 0 to 60, and the x-axis shows time in months from 0 to 48. The graph includes a note of 16.1% risk reduction and a p-value of 0.022.*

* About these descriptions: Image descriptions on this page are generated by automated AI analysis of the product label images from the manufacturer's FDA label submission (SPL). They are provided for reference only and may contain errors or omissions. Always rely on the printed label itself and the official FDA labeling, and consult a pharmacist or healthcare professional with any questions about this product.