Product Images Finasteride

View Photos of Packaging, Labels & Appearance

Product Label Images

The following 7 images provide visual information about the product associated with Finasteride NDC 70518-3616 by Remedyrepack Inc., such as packaging, labeling, and the appearance of the drug itself. This resource could be helpful for medical professionals, pharmacists, and patients seeking to verify medication information and ensure they have the correct product.

Remedy_Label - Remedy Label

Remedy_Label - Remedy Label

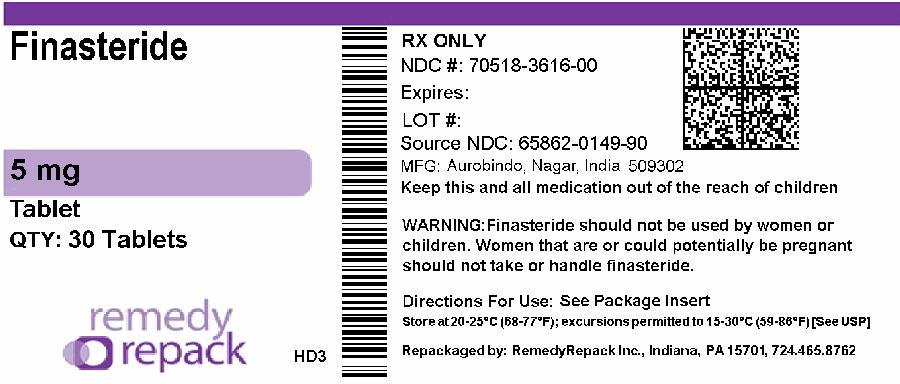
Finasteride is a medication available in the form of 5 mg tablets with 30 pills per bottle. It is manufactured by Aurohindo located in Nagar, India. The medication comes with a warning stating that it is not suitable for women or children, and women who could potentially become pregnant. The directions for use can be found in the package insert. The medication should be stored in a cool and dry place, away from children. It has been repackaged by RemedyRepack Inc in Indiana.*

Figure 1 Symptom Score in a Long-Term Efficacy and Safety Study - finasteride fig1

Figure 1 Symptom Score in a Long-Term Efficacy and Safety Study - finasteride fig1

This appears to be a chart showing the mean change from baseline in symptom score for two long-term efficacy and safety studies using placebo and finasteride. The chart displays data for a period of 4 years (baseline, year 1, year 2, year 3, and year 4). The numbers listed under "Finasteride" indicate the mean change from baseline for each year of the study. It is not possible to determine the unit of measurement or the specific condition being studied without more context.*

Figure 2 Percent of Patients Having Surgery for BPH, Including TURP - finasteride fig2

Figure 2 Percent of Patients Having Surgery for BPH, Including TURP - finasteride fig2

This appears to be a figure displaying the percentage of patients who had surgery for BPH (benign prostatic hyperplasia) while taking either finasteride or a placebo over an observation time of up to 48 months. The graph shows that the percentage of patients who underwent surgery was lower in the finasteride group compared to the placebo group. The numbers of events and patients at risk are also shown for each group.*

Figure3 - finasteride fig3

Figure3 - finasteride fig3

Figure4 - finasteride fig4

Figure4 - finasteride fig4

This text shows a chart (Figure 4) presenting the Mean Percent Change from Baseline + 1 SE in Prostate Volume in a Long-Term Efficacy and Safety Study. The chart shows the baseline, year 1, year 2, year 3, and year d results for a placebo group (n=155) and a Finasteride group (n=157). The results indicate a decrease in prostate volume over the years for both groups.*

Figure5 - finasteride fig5

Figure5 - finasteride fig5

chemical structure - finasteride str

chemical structure - finasteride str

* The product label images have been analyzed using a combination of traditional computing and machine learning techniques. It should be noted that the descriptions provided may not be entirely accurate as they are experimental in nature. Use the information in this page at your own discretion and risk.